


□ KAGE: fast alignment-free graph-based genotyping of SNPs and short indels
>> https://genomebiology.biomedcentral.com/articles/10.1186/s13059-022-02771-2
KAGE – a new genotyper for SNPs and short indels that builds on recent ideas of alignment-free genotyping from Malva and PanGenie for computationally efficiency. KAGE is able to genotype a full sample with 15x coverage in only about 12 minutes using 16 compute cores.
KAGE and PanGenie, which are completely alignment-free, are able to achieve very close accuracy to Graphtyper, which first maps and aligns all reads using BWA-MEM and then locally realigns all reads to a sequence graph.
KAGE genotypes a bi-allelic variant. The different possible genotypes are calculated using combinations of Poisson models. KAGE uses a graph-representation of all variants, and considers all possible ways to pick kmers around the two alleles of a variant.
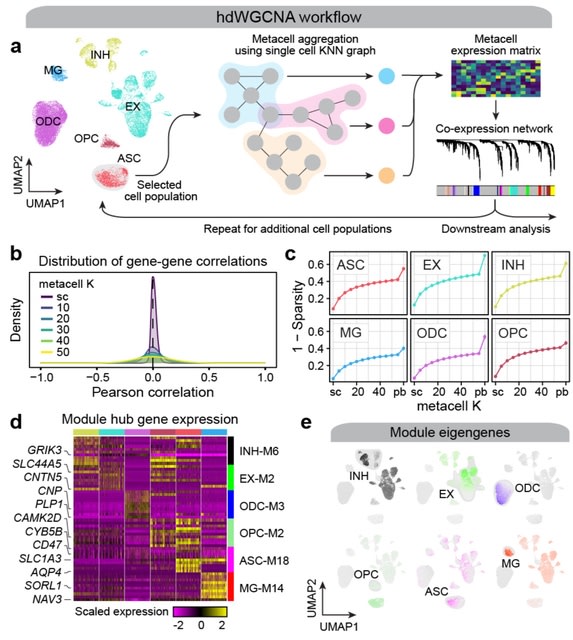
□ hdWGCNA: High dimensional co-expression networks enable discovery of transcriptomic drivers in complex biological systems
>> https://www.biorxiv.org/content/10.1101/2022.09.22.509094v1
hdWGCNA is capable of performing isoform-level network analysis using long-read single-cell data. hdWGCNA is directly compatible with Seurat, and demonstrates the scalability of hdWGCNA by analyzing a dataset containing nearly one million cells.
hdWGCNA provides a succinct methodology for investigating systems-level changes in the transcriptome in sc-datasets. The hdWGCNA workflow accounts for the considerations by collapsing highly similar cells into "metacells" to reduce sparsity while retaining cellular heterogeneity.
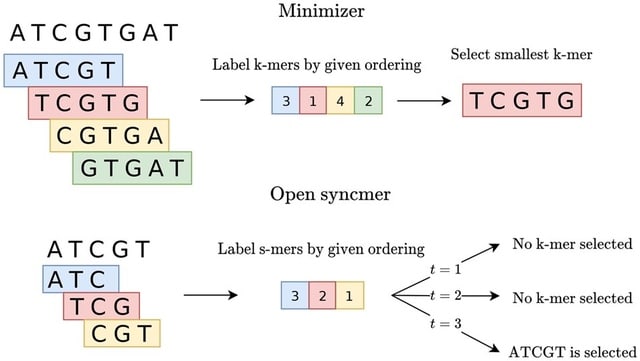
□ Theory of local k-mer selection with applications to long-read alignment
>> https://academic.oup.com/bioinformatics/advance-article/doi/10.1093/bioinformatics/btab790/6432031
An exact expression for calculating the conservation of a k-mer selection method. This turns out to be tractable enough for us to prove closed-form expressions for a variety of methods, including (open and closed) syncmers, (a, b, n)-words, and an upper bound for minimizers.
Modifying the minimap2 read aligner to use a more conserved k-mer selection method and demonstrate that there is up to an 8.2% relative increase in number of mapped reads.
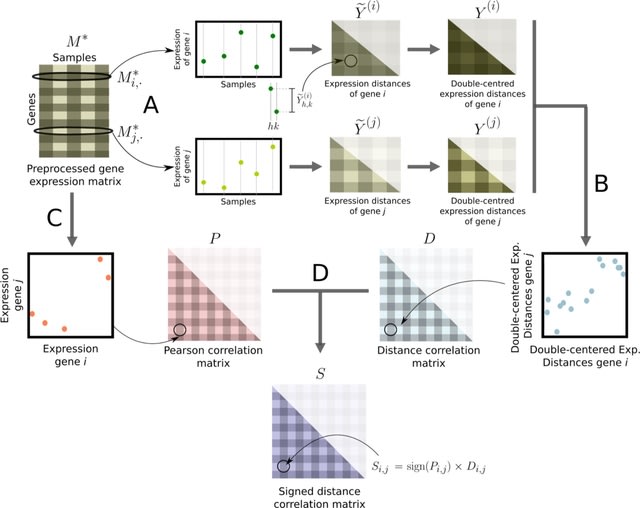
□ sdcorGCN: Generating weighted and thresholded gene coexpression networks using signed distance correlation
>> https://www.cambridge.org/core/journals/network-science/article/generating-weighted-and-thresholded-gene-coexpression-networks-using-signed-distance-correlation/
sdcorGCN, a principled method to construct weighted gene coexpression networks using signed distance correlation. These networks contain weighted edges only between those pairs of genes whose correlation value is higher than a given threshold.
sdcorGCN constructs networks from signed distance correlations in combination with COGENT. A signed network with weights associated with its edges might include valuable information since the sign of the weights allow to differentiate positive and negative associations.
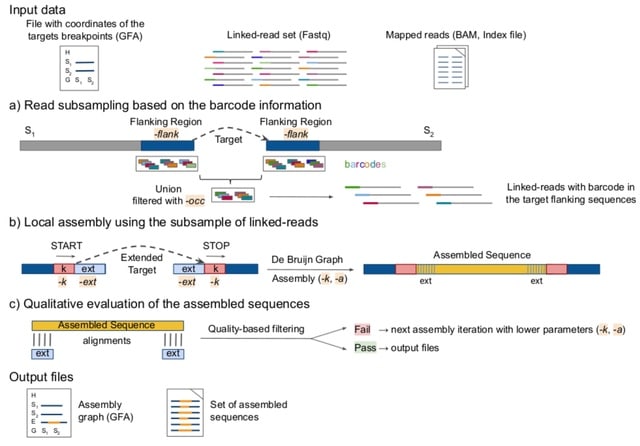
□ MTG-Link: leveraging barcode information from linked-reads to assemble specific loci
>> https://www.biorxiv.org/content/10.1101/2022.09.27.509642v1
The main feature of MTG-Link is that it takes advantage of the linked-read barcode information to get a subsample of reads of interest for the local assembly of each sequence.
MTG-Link can be used for various local assembly use cases, such as intra-scaffold and inter-scaffold gap-fillings, as well as the reconstruction of the alternative allele of large insertion variants.
The input of MTG-Link is a set of linked-reads, the target flanking sequences and coordinates in GFA format (genome graph format, with the flanking sequences identified as ”segment” elements (S lines) and the targets identified as ”gap” elements.
In MTG-Link, each target sequence is processed independently in a three-steps process: read subsampling using the barcode information of the linked-read dataset, local assembly by de Bruijn graph traversal and qualitative evaluation of the obtained assembled sequence.
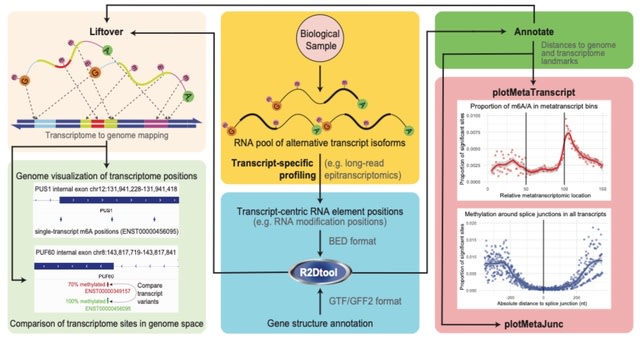
□ R2Dtool: Positional interpretation of RNA-centric information in the context of transcriptomic and genomic features
>> https://www.biorxiv.org/content/10.1101/2022.09.23.509222v1
R2Dtool, a utility for long-read isoform-centric epitranscriptomics that annotates (epi)transcriptomic positions with transcript-specific metatranscript coordinates and proximity to adjacent splice-junctions.
R2Dtool transposes transcriptomic coordinates to their underlying genomic coordinates to enable the comparison of epitranscriptomic sites between overlapping transcript isoforms.
Using the transcriptomic positions of relevant sites provided in transcript-centric BED and the corresponding gene structures in GTF/GFF. R2_annotate.R calculates for each site of interest the distances to the available annotation features, such as the start and end of the ORF.
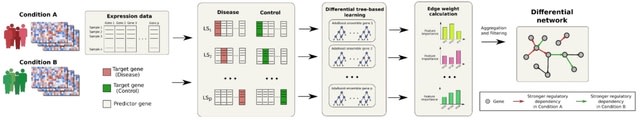
□ BoostDiff: Inference of differential gene regulatory networks from gene expression data using boosted differential trees
>> https://www.biorxiv.org/content/10.1101/2022.09.26.509450v1
BoostDiff is a non-parametric approach for reconstructing directed differential networks. BoostDiff modifies regression trees to use differential variance improvement (DVI) as the novel splitting criterion.
BoostDiff concentrates on maximizing the precision for those parts of the regulatory network that actually predict the difference between the two phenotypes. The network is inferred by building modified AdaBoost ensembles of differential trees as base learners.
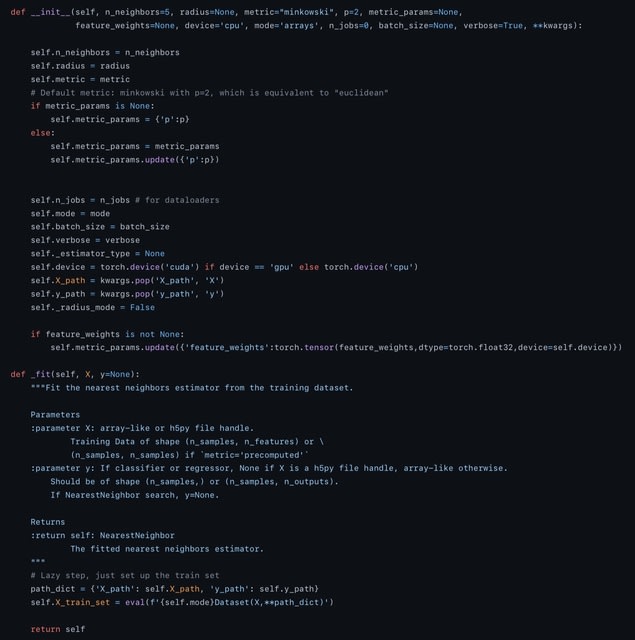
□ SIMBSIG: Similarity search and clustering for biobank-scale data
>> https://www.biorxiv.org/content/10.1101/2022.09.22.509063v1
SIMBSIG is a GPU accelerated software tool for neighborhood queries, KMeans and PCA which mimics the sklearn API. SIMBSIG is imlemented a batched KNN search, and a radius neighbour search, where all neighbours within a user-defined radius are returned.
SIMBSIG uses a brute-force approach only due to the infeasibility of other exact methods in this scenario, while retaining most other functionality of scikit-learn such as the choice of a range of metrics including all lp distances.
The speed of SIMBSIG was benchmarked on an artificial dataset, where SNPs are encoded according to dominance assumption. They sampled “participants” represented by a 10, 000 dimensional vector with independent entries, representing 10, 000 SNPs with probabilities {0.6, 0.2, 0.2}.
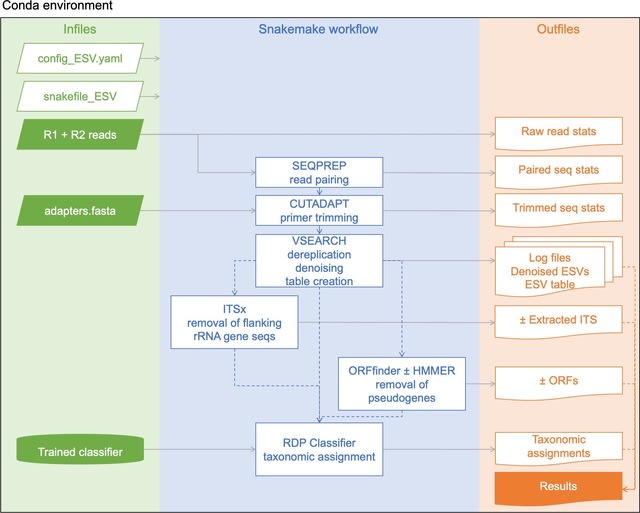
□ MetaWorks: A flexible, scalable bioinformatic pipeline for high-throughput multi-marker biodiversity assessments
>> https://journals.plos.org/plosone/article?id=10.1371/journal.pone.0274260
MetaWorks provides a harmonized processing environment, pipeline, and taxonomic assignment approach for demultiplexed Illumina reads for all biota using a wide range of metabarcoding markers such as 16S, ITS, and COI.
MetaWorks uses VSEARCH ‘cluster_smallmem’ method to cluster ESVs using a 97% sequence similarity cutoff. Settings can be adjusted in the in the config_OTU.yaml file such as pointing to the directory that contains the ESVs and choosing a classifier for the OTUs.
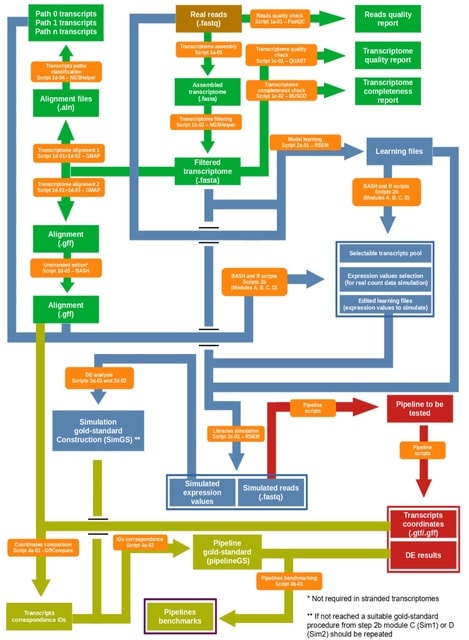
□ DEGoldS: a workflow to assess the accuracy of differential expression analysis pipelines through gold-standard construction
>> https://www.biorxiv.org/content/10.1101/2022.09.13.507753v1
DEGoldS allows to test between multiple DE analysis pipelines and to select the one that produce less bias in DE inference. The way RSEM utilizes the information about the expression values to simulate libraries is very suitable for the gold-standard construction.
DEGoldS can accommodate to diverse pipeline configurations, it operates by testing several modifications to the widely used reference-guided StringTie pipeline and by performing two simulation scenarios: a simpler and less realistic one and a more realistic but more complex one.
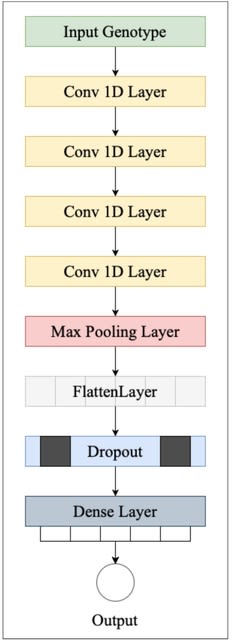
□ NovGMDeep: Predicting Phenotypes From Novel Genomic Markers Using Deep Learning
>> https://www.biorxiv.org/content/10.1101/2022.09.21.508954v1
NovGMDeep, a one-dimensional (1D) deep convolutional neural network, to predict the different phenotypes from novel genomic markers-SVs and TEs. NovGMDeep learns the complex relationships between genome-wide markers and phenotypic traits from the training data.
The NovGMDeep model has four 1D convolutional layers, a single 1D max-pooling layer, a flatten layer and one dropout layer followed by a fully connected layer. rrBLUP and gBLUP were evaluated with the same data to compare their overall prediction performance with NovGMDeep.

□ voomQWB: Modelling group heteroscedasticity in single-cell RNA-seq pseudo-bulk data
>> https://www.biorxiv.org/content/10.1101/2022.09.12.507511v1
The methods that account for heteroscedastic groups, namely voomByGroup and voomQW using a blocked design, have superior perfor- mance in this regard when group variances are unequal.
voomQWB models group-wise mean-variance relationships via roughly parallel trend-lines, which has the disadvantage of not being able to capture more complicated shapes observed in different datasets. voomByGroup estimates distinct group-specific trends.

□ Genozip 14 - advances in compression of BAM and CRAM files
>> https://www.biorxiv.org/content/10.1101/2022.09.12.507582v1
Since CRAM aims to be an official standard, its development process is driven by a slow, consensus-oriented, multi-organisation collaboration, and it is purposely oblivious to the non-standard extensions of SAM tags introduced by tools developed to support various study types.
Genozip 14 demonstrates significantly superior compression of BAM and CRAM files compared to CRAM 3.1, and hence it would be a good choice for users seeking to minimise consumption of storage resources, for both archival purposes and for use in bioinformatics pipelines.
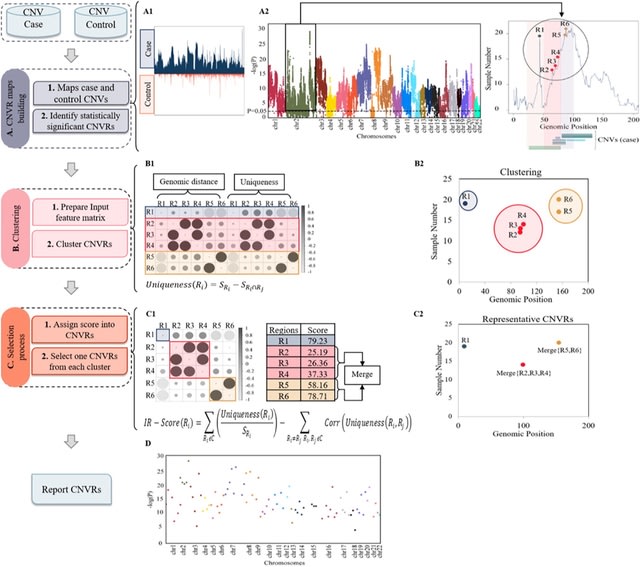
□ PeakCNV: A multi-feature ranking algorithm-based tool for genome-wide copy number variation-association study
>> https://www.sciencedirect.com/science/article/pii/S2001037022004068
PeakCNV, a novel AI based tool to correct this bias by distinguishing independent CNVR associations from that of confounding CNVRs within the same loci, resulting in identifying more accurate and biological meaningful list of CNVRs associated with phenotype of interest.
PeakCNV calculates a new metric, which we termed independence ranking score (IR-score) via a feature ranking algorithm. IR-score identifies a true positive CNVR when its significance of association is independent of any other overlapping or co-occurring CNVRs within that cluster.

□ Evaluation of classification in single cell atac-seq data with machine learning methods
>> https://bmcbioinformatics.biomedcentral.com/articles/10.1186/s12859-022-04774-z
These 6 traditional methods are all from the scikit-learn library: SVM with linear kernel, nearest mean classifier (NMC), random forest (RF), decision tree (DT), linear discriminant analysis (LDA) and k-nearest neighbor (KNN).
SVM performed best among all machine learning methods in intra-dataset experiments across most cell types in various datasets. In contrast, KNN no matter with setting 9 or 50 nearest neighbors performed poorly in all datasets with only a few cells are correctly characterized.

□ Gaussian graphical models with applications to omics analyses
>> https://onlinelibrary.wiley.com/doi/10.1002/sim.9546
The mathematical foundations of Gaussian graphical models (GGMs) are introduced with the goal of enabling the researcher to draw practical conclusions by interpreting model results.
Both the covariance matrix screening and the separate estimation of the K connected components of the GGM are tasks that are amenable to parallelization; thus problems that had previously been too large to be computationally tractable could be quickly solved.
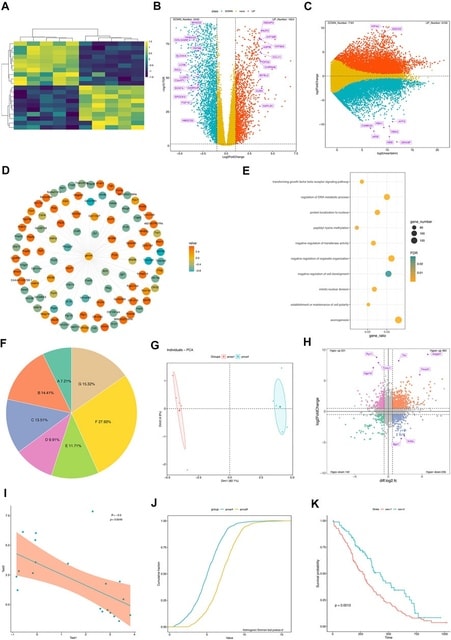
□ GraphBio: A shiny web app to easily perform popular visualization analysis for omics data
>> https://www.frontiersin.org/articles/10.3389/fgene.2022.957317/full
GraphBio specifically focuses on facilitating the generation of publication-ready plots easily and rapidly instead of data preprocessing and computing. Users can easily prepare data to be visualized by Excel software based on given reference example files from GraphBio.
GraphBio provides 15 modules, incl. heatmap, volcano plots, MA plots, network plots, dot plots, chord plots, pie plots, four quadrant diagrams, Venn diagrams, cumulative distribution curves, PCA, survival analysis, ROC analysis, correlation analysis, and text cluster analysis.
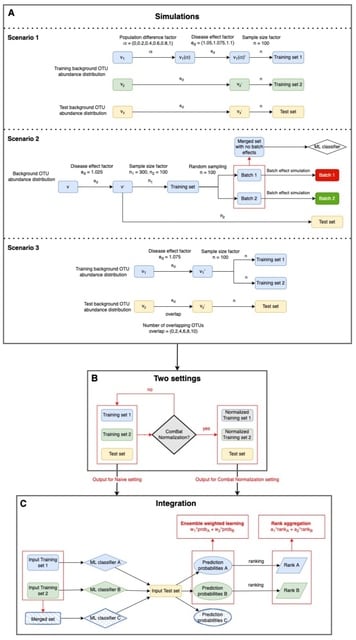
□ Batch Normalization Followed by Merging Is Powerful for Phenotype Prediction Integrating Multiple Heterogeneous Studies
>> https://www.biorxiv.org/content/10.1101/2022.09.28.509843v1
A comprehensive workflow to simulate a variety of different types of heterogeneity and evaluate the performances of different integration methods together with batch normalization by using ComBat.
Combined with batch normalization, merging strategy and ensemble weighted learning methods both can boost machine learning classifier’s performance in phenotype predictions.
The rank aggregation methods should be considered as alternative way to boost prediction performances, given that these methods showed similar robustness as ensemble weighted learning methods.
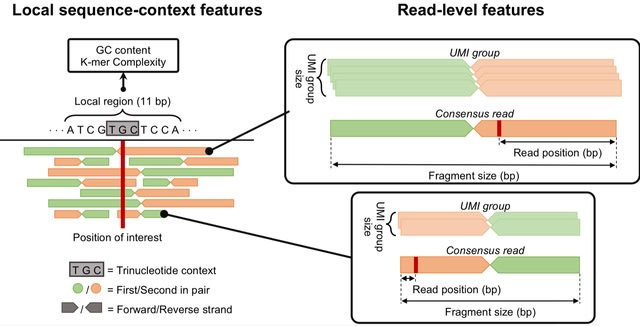
□ DREAMS: Deep Read-level Error Model for Sequencing data applied to low-frequency variant calling and circulating tumor DNA detection
>> https://www.biorxiv.org/content/10.1101/2022.09.27.509150v1
DREAMS (Deep Read-level Modelling of Sequencing-errors) that incorporates both read-level and local sequence-context features for positional error rate estimation.
DREAMS-cc aggregates the signal across a catalogue of mutations for accurate estimation of the tumor fraction and sensitive determination of the overall cancer status.
DREAMS was built to exploit read-level features under the assumption that these affect the error rate in sequencing data. Thus, the power of this approach increases with the variability in the error rate explained by read level features.

□ Down the Penrose stairs: How selection for fewer recombination hotspots maintains their existence
>> https://www.biorxiv.org/content/10.1101/2022.09.27.509707v1
The loss of a small number of strong binding sites leads to the use of a greater number of weaker ones, resulting in a sharp reduction in symmetric binding and favoring new PRDM9 alleles that restore the use of a smaller set of strong binding sites.
This decrease in PRDM9 binding symmetry and in its ability to promote DSB repair drive the rapid zinc finger turnover. The advantage of new PRDM9 alleles is in limiting the number of binding sites used effectively, rather than in increasing net PRDM9 binding, as previously believed.
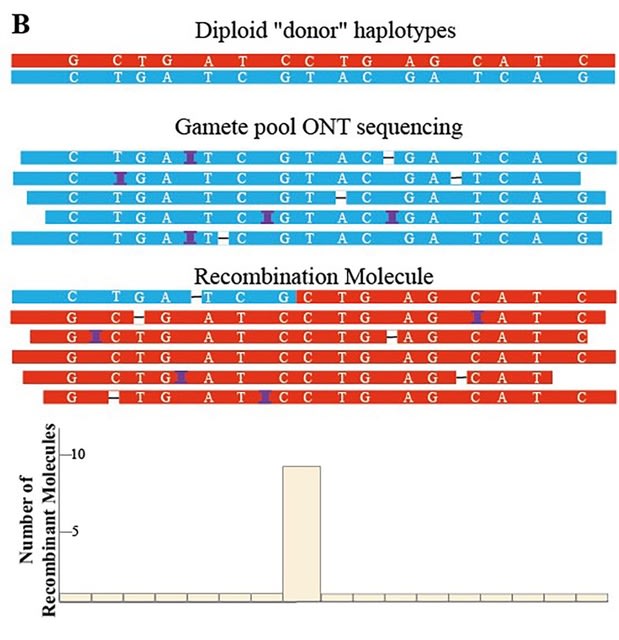
□ NanoCross: A pipeline that detecting recombinant crossover using ONT sequencing data
>> https://www.sciencedirect.com/science/article/pii/S0888754322002440
NanoCross first reduced sequencing errors and then constructed individual haplotypes based on homopolymer-filtered ONT sequences. Then, each molecule read is used to estimate cross recombination.
In the case of moderate heterozygous variation density and sequencing depth, NanoCross offers a good level of sensitivity. The last step was to detect the phase of the ONT reads using a sliding window method script with the BAM file and haplotype information as input.

□ RTX-KG2: a system for building a semantically standardized knowledge graph for translational biomedicine
>> https://bmcbioinformatics.biomedcentral.com/articles/10.1186/s12859-022-04932-3
RTX-KG2 is the first knowledge graph that integrates UMLS, SemMedDB, ChEMBL, DrugBank, Reactome, SMPDB, and 64 additional knowledge sources within a knowledge graph that conforms to the Biolink standard for its semantic layer and schema.
The RTX-KG2 system is a registered knowledge provider within Translator. To ensure that Translator’s various systems can interoperate, Biolink has been adapted as the semantic layer for concepts and relations for knowledge representation within the Translator project.
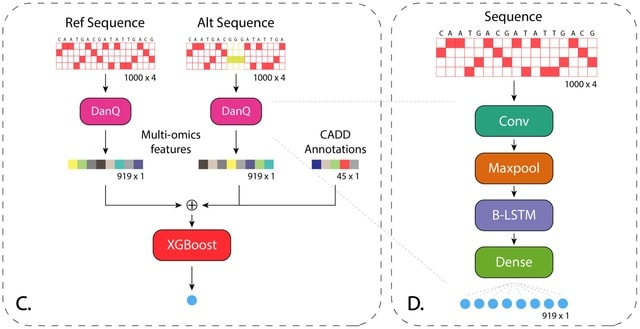
□ TIVAN-indel: A computational framework for annotating and predicting noncoding regulatory small insertion and deletion
>> https://www.biorxiv.org/content/10.1101/2022.09.28.509993v1
TIVAN- indel, which is an XGBoost-based supervised framework for scoring noncoding sindels based their potential to regulate the nearby gene expression.
TIVAN-indel leverages both generic CADD annotations and large-scale tissue/cell type-specific multi-omics features derived from deep learning model. TIVAN-indel achieves the best prediction in both cross-validation with-tissue prediction and independent cross-tissue evaluation.
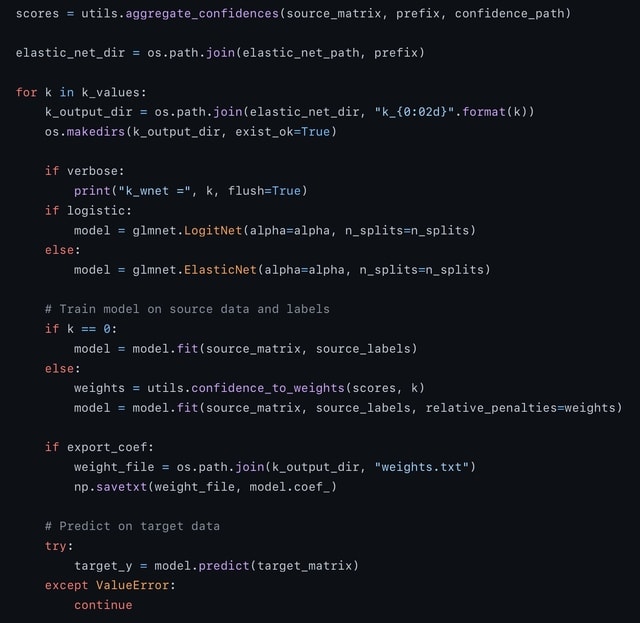
□ wenda_gpu: fast domain adaptation for genomic data
>> https://academic.oup.com/bioinformatics/advance-article/doi/10.1093/bioinformatics/btac663/6747951
wenda_gpu uses GPyTorch to train models on genomic data within hours on a single GPU-enabled machine. wenda trains a model on the rest of the source data, and generates a confidence score based on how well that model is able to predict the observed feature values.
These confidence values are used as weighted penalties for the ultimate elastic net task, training the source data on the source labels. This script will train several models, a vanilla (unweighted) elastic net and with a variety of penalization amounts based on confidence score.

□ CelFEER: Cell type deconvolution of methylated cell-free DNA at the resolution of individual reads
>> https://www.biorxiv.org/content/10.1101/2022.09.30.510300v1
CelFEER (CELl Free DNA Estimation via Expectation-maximization on a Read resolution) uses essentially the same model as CelFiE but with read averages as input. This changes the underlying distributions of the model, while the overall structure of the algorithm remains the same.
CelFEER estimates of generated data correlate to true proportions. CelFEER is an efficient method that scales linearly in the size of the input and reference. The use of CelFEER in practical applications should be investigated further by testing the model on more cfDNA data.

□ READemption 2: Multi-species RNA-Seq made easy
>> https://www.biorxiv.org/content/10.1101/2022.09.30.510338v1
READemption 2.0 performs all necessary steps to handle RNA-seq data from any number of species, incl. quality filtering / adapter trimming / aligning the reads / generating nucleotide-wise coverage files / creating gene-wise read counts / performing differential GE analysis.
READemption 2.0 uses the alignment files (BAM files) of the initial alignment to generate template fragments from paired-end reads and writes them to a new BAM file containing the template fragments represented as single-end reads.
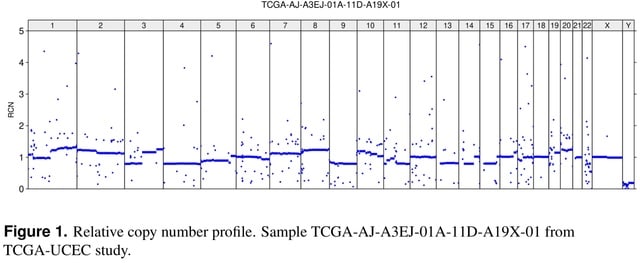
□ CNHplus: the chromosomal copy number heterogeneity which respects biological constraints
>> https://www.biorxiv.org/content/10.1101/2022.09.30.510279v1
A deficiency in CNH is pointed out. The absolute copy number (ACN) profile obtained by solving the CNH optimization problem may contain negative number of copies.
CNHplus corrects the flaw by imposing the non-negativity constraint. CNHplus is applied to survival stratification of patients from the TCGA studies. Also, it is discussed which other biological constraints should be incorporated into CNHplus.

□ GsRCL: Improving cell-type identification with Gaussian noise-augmented single-cell RNA-seq contrastive learning
>> https://www.biorxiv.org/content/10.1101/2022.10.06.511191v1
The GsRCL method consists of two stages of training. (a) The first stage is to use Gaussian noise N to create two views (s ̃1 and s ̃2) of the original input scRNA-seq expression profiles s.
These two new views are encoded by an encoder G and then projected into a latent space by a projector head H . Those two projected feature representations are pushed closer in the latent space by the contrastive learning loss.
GsRCL uses an SVM classifier and a validation dataset to select the optimal encoder whose generated feature representations lead to the highest predictive accuracy. The Gaussian noise augmentation method outperformed all random genes masking data augmentation methods.
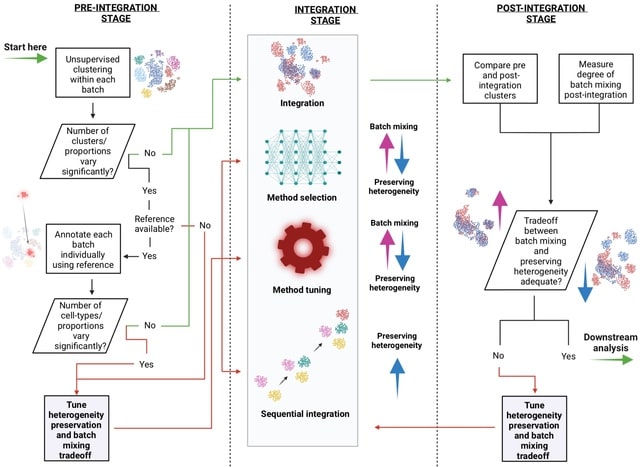
□ The differential impacts of dataset imbalance in single-cell data integration
>> https://www.biorxiv.org/content/10.1101/2022.10.06.511156v1
Two key factors were found to lead to quantitation differences after scRNA-seq integration - the cell-type imbalance within and between samples (relative cell-type support) and the relatedness of cell-types across samples (minimum cell-type center distance).
This novel clustering metrics robust to sample imbalance, incl. the balanced Adjusted Rand Index (bARI) and balanced Adjusted Mutual Information (bAMI).
The calculation of the entropy and mutual information can proceed as-is after the normalization procedure, and this will balance the contributions from a presumed ground-truth partition in calculating the entropy and mutual information.
<bt />

□ MetaRNN: differentiating rare pathogenic and rare benign missense SNVs and InDels using deep learning
>> https://genomemedicine.biomedcentral.com/articles/10.1186/s13073-022-01120-z
MetaRNN and MetaRNN-indel, to help identify and prioritize rare nonsynonymous single nucleotide variants (nsSNVs) and non-frameshift insertion/deletions (nfINDELs).
MetaRNN / MetaRNN-indel scores are compatible, which filled another gap by providing a one-stop annotation score. This improvement is expected to be applicable across various settings, such as integrated rare-variant burden tests for genotype-phenotype association.

□ MAMBA: a model-driven, constraint-based multiomic integration method
>>
MAMBA (Metabolic Adjustment via Multiomic Blocks Aggregation), a CBM approach that enables the use of semi-quantitative metabolomic data together with a gene-centric omic data type, and the combination of different time points and conditions.
MAMBA captured known biology of heat stress in yeast and identified novel affected metabolic pathways. MAMBA was implemented as an integer linear programming (ILP) problem to guarantee efficient computation, and coded for MATLAB.


※コメント投稿者のブログIDはブログ作成者のみに通知されます