(Murat Pak)

□ SIGMA: A clusterability measure for single-cell transcriptomics reveals phenotypic subpopulations
>> https://www.biorxiv.org/content/10.1101/2021.05.11.443685v1.full.pdf
Using just these singular values and the dimensions of the measurement matrix, calculating the angles between the singular vectors of the measured expression matrix and those of the (unobserved) signal matrix.
SIGnal-Measurement-Angle (SIGMA), a clusterability measure derived from random matrix theory, that can be used to identify cell clusters with non-random sub-structure, testably leading to the discovery of previously overlooked phenotypes.
SIGMA corresponded well with a visual inspection of the cluster UMAPs. For all clusters, the bulk of the singular value distribution was well-described by the MP distribution and, by construction, only clusters with SIGMA > 0 had significant singular values.
SIGMA identifies variance-driving genes and brings renewed awareness to random noise as a factor setting hard limits on clustering and identifying differential expression. The relationship between the largest singular values and SIGMA only depends on the dimensions of the expression matrix.
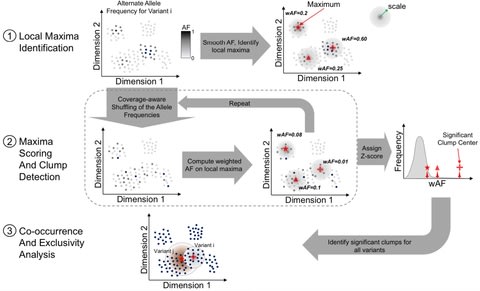
□ XCVATR: Detection and Characterization of Variant Impact on the Embeddings of Single -Cell and Bulk RNA-Sequencing Samples
>> https://www.biorxiv.org/content/10.1101/2021.06.01.446668v1.full.pdf
XCVATR makes use of local spatial geometry of the embedding and multiscale analysis to provide a comprehensive workflow for detecting expressed variant clumps.
XCVATR relies on the distance matrix between cells based on the transcriptomic profiles. the first step is read count quantification for each cell, which are used for computing either the embedding coordinates or building the distance matrix directly from the expression levels.

□ scPhere: Deep generative model embedding of single-cell RNA-Seq profiles on hyperspheres and hyperbolic spaces
>> https://www.nature.com/articles/s41467-021-22851-4
scPhere minimizes the distortion by embedding cells to a lower-dimensional hypersphere instead of a low-dimensional Euclidean space, using von Mises–Fisher (vMF) distributions on hyperspheres as the posteriors for the latent variables.
Because the prior is a uniform distribution on a unit hypersphere and the uniform distribution on a hypersphere has no centers, points are no longer forced to cluster in the center of the latent space.
Applying scPhere with a hyperspherical latent space to each of the “small” datasets readily distinguished cell subsets. scPhere embeds cells to the hyperbolic space of the Lorentz model and visualize the embedding in a Poincaré disk.

□ Scelestial: fast and accurate single-cell lineage tree inference based on a Steiner tree approximation algorithm
>> https://www.biorxiv.org/content/10.1101/2021.05.24.445405v1.full.pdf
Scelestial, a method for lineage tree reconstruction from single-cell datasets, based on the Berman approximation algorithm for the Steiner tree problem. Scelestial infers the evolutionary history for single-cell data in the form of a lineage tree and imputes the missing values accordingly.
Scelestial is designed in a dynamic program that finds internal node sequences with non-missing values. Scelestial models a hypercube corresponding to the missing values with one representative vertex.

□ Minimizer-space de Bruijn graphs
>> https://www.biorxiv.org/content/10.1101/2021.06.09.447586v1.full.pdf
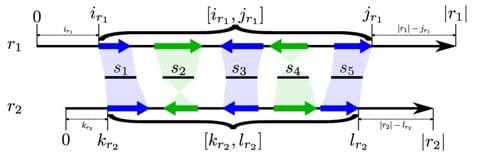
the concept of minimizer-space sequencing, where the minimizers rather than DNA nucleotides are the atomic tokens. By projecting DNA sequences into ordered lists of minimizers, the key is to enumerate k-min-mers - k-mers over a larger alphabet consisting of minimizer tokens.
mdBG, achieves orders-of-magnitude improvement in both speed and memory usage over existing methods without much loss of accuracy. To handle higher sequencing error rates, mdBG newly corrects for base errors by performing partial order alignment instead in minimizer-space.
□ VSTseed: periodic spaced seeds for reads with substitutions
>> https://www.biorxiv.org/content/10.1101/2021.06.09.447791v1.full.pdf
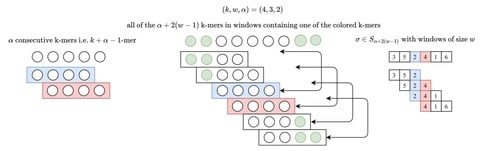
The minimum length of reads required for seeds of given weight is almost a linear function (or more strictly, an affine function) of a number of substitutions allowed.
VSTseed generates the seeds for reads of a given length and a known maximum number of substitutions, convert the spaced seeds into contiguous arrays (in order to generate “signatures”) using SIMD instructions.

□ Reverse-Complement Equivariant Networks for DNA Sequences
>> https://www.biorxiv.org/content/10.1101/2021.06.03.446953v1.full.pdf
a given DNA segment can be sequenced as two RC DNA sequences, depending on which strand is sequenced; any predictive model for, e.g., DNA sequence classification should therefore be reverse complement-invariant, which calls for RC-equivariant architectures.
Reverse Complement-equivariant pointwise nonlinearities adapted to different representations, as well as RC-equivariant embeddings of k-mers as an alternative to one-hot encoding of nucleotides.

□ Automated Boolean rule inference for models of biological processes: Unsupervised logic-based mechanism inference for network-driven biological processes
>> https://journals.plos.org/ploscompbiol/article?id=10.1371/journal.pcbi.1009035
a generalizable, unsupervised approach to generate parameter-free, Boolean logic-based models of cellular processes, described by multiple discrete states. The algorithm employs a Hamming-distance based approach to formulate, test, and identify optimized logic rules.
The algorithm automatically recovers the relevant dynamics for the explored models and recapitulates key aspects of the biochemical species concentration dynamics by the Boolean formalism.
□ muon: Multimodal omics Python framework
>> https://github.com/gtca/muon
muon operates on multimodal data (MuData) that represents modalities as collections of AnnData objects. These collections can be saved to disk and retrieved using HDF5-based .h5mu files, which design is based on .h5ad file structure.
muon can incorporate disjoint multimodal experiments, i.e. the ones with different cells having different modalities measured. No redundant empty measurements are stored due to the distinct feature sets per assay as well as distinct cell sets mapped to a global set of observations.

□ MC-eNN: A multi-modal coarse grained model of DNA flexibility mappable to the atomistic level
>> https://academic.oup.com/nar/article/48/5/e29/5709710
an evolution of the helical CG model which assumes a novel multi-normal model which accounts for the non-Gaussian nature of some inter base pair deformations and considers a flexible extended nearest neighbor model.
a new Hamiltonian inspired by empirical valence bond theory, where they assume that the distribution of inter base pair parameters (shift, slide, rise, tilt, roll, twist) underlies a Boltzmann-averaged combination of Gaussian distributions.
The bi-dimensional inter base pair parameter distributions of MD and MC-eNN simulations are indistinguishable even when correlated in a highly non-linear manner which is impossible to capture by a standard harmonic model.

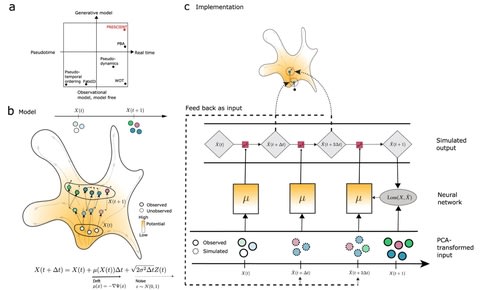
□ SOPHIE: Generative neural networks separate common and specific transcriptional responses
>> https://www.biorxiv.org/content/10.1101/2021.05.24.445440v1.full.pdf
SOPHIE, “Specific cOntext Pattern Highlighting In Expression data” produces a background set of transcriptomic experiments from which a gene and pathway-specific null distribution can be generated.
SOPHIE’s measure of specificity can complement log fold change activity generated from traditional differential expression analyses by, for example, filtering the set of changed genes to identify those that are specifically relevant to the experimental condition of interest.
SOPHIE uses this VAE approach to simulate realistic-looking transcriptome experiments that serve as a background set for analyzing common versus specific transcriptional signals.

□ Accel-Align: a fast sequence mapper and aligner based on the seed–embed–extend method
>> https://bmcbioinformatics.biomedcentral.com/articles/10.1186/s12859-021-04162-z
Using the SEE-approach to sequence alignment, Accel-Align can align 280,000 100bp reads per second on a commodity quad-core CPU, and is up to 9× faster than BWA-MEM, 12× faster than Bowtie2, and 3× faster than Minimap2.
Accel-Align calculates the Hamming distance between each embedded reference and the read, and selects the best candidates with the lowest Hamming distance for extension. Accel-Align processes each read by first extracting seeds to find candidate locations similar to SFE aligners.

□ SKSV: ultrafast structural variation detection from circular consensus sequencing reads
>> https://academic.oup.com/bioinformatics/advance-article-abstract/doi/10.1093/bioinformatics/btab341/6272511
SKSV constructs a direct acyclic graph with all the extend matches and implement sparse dynamic programming to find an optimal path in the graph to build an alignment skeleton. SKSV greedily extracts potential SV signatures by identifying non-co-linear alignment segments.
SKSV collects the maximal exact matches between unitigs in the reference de Bruijn graph and the read. And uses Landau-Vishkin algorithm to extend U-MEMs along the reference genome with a user-defined maximal edit distance.
□ GSpace: an exact coalescence simulator of recombining genomes under isolation by distance
>> https://academic.oup.com/bioinformatics/advance-article-abstract/doi/10.1093/bioinformatics/btab261/6272571
Simulation-based inference can bypass the limitations of statistical methods based on analytical approximations, but software allowing simulation of structured population genetic data without the classical n-coalescent approximations are scarce or slow.
GSpace, a simulator for genomic data, based on a generation-by-generation coalescence algorithm taking into account small population size, recombination, and isolation by distance.

□ SC3s - efficient scaling of single cell consensus clustering to millions of cells
>> https://www.biorxiv.org/content/10.1101/2021.05.20.445027v1.full.pdf
SC3s - Single Cell Consensus Clustering with Speed, where several steps of the original workflow have been optimized to ensure that both run time and memory usage scale linearly with the number of cells.
SC3s uses a streaming approach for the k-means clustering which makes it possible to only process a small subset of cells in each iteration. as part of an intermediary step, which was not part of the original method, a large number of microclusters are calculated.

□ SHINE: Structure Learning for Hierarchical Regulatory Networks
>> https://www.biorxiv.org/content/10.1101/2021.05.27.446022v1.full.pdf
SHINE - Structure Learning for Hierarchical Networks - a framework for defining data-driven structural constraints and incorporating a shared learning paradigm for efficiently learning multiple networks from high-dimensional data.
SHINE uses used the Random Walk with Restart algorithm, and improves performance when relatively few samples are available and multiple networks are desired, by reducing the complexity of the graphical search space and by taking advantage of shared structural information.
□ AQUARIUM: accurate quantification of circular isoforms using model-based strategy
>> https://academic.oup.com/bioinformatics/advance-article-abstract/doi/10.1093/bioinformatics/btab435/6296829
AQUARIUM (Accurate QUAntification of circulaR Isoforms Using Model-based strategy) accepts output of circRNA identification tools (CIRI, CIRI-full) or a BED-format file to specify the circular RNA transcripts. Then, it transforms all circular transcripts to pseudo-linear transcripts. Finally, it estimates the expression of both linear and circular transcripts using salmon framework.

□ Deep cross-omics cycle attention model for joint analysis of single-cell multi-omics data
>> https://academic.oup.com/bioinformatics/advance-article-abstract/doi/10.1093/bioinformatics/btab403/6283577
Deep cross-omics cycle attention (DCCA) model, a computational tool for joint analysis of single-cell multi-omics data, by combining variational autoencoders (VAEs) and attention-transfer.
the DCCA model learned a coordinated but separate representation for each omics data, by mutually supervising each other based on semantic similarity between embeddings, and then reconstructed back to the original dimension as output through a decoder for each omics data.

□ Identifying strengths and weaknesses of methods for computational network inference from single cell RNA-seq data
>> https://www.biorxiv.org/content/10.1101/2021.06.01.446671v1.full.pdf
While no method is a universal winner and most methods have a modest recovery of experimentally derived interactions based on global metrics such as AUPR, methods are able to capture targets of regulators that are relevant to the system under study.
LEAP and SILGGM to form a cluster on Shalek compared to another group comprising SCRIBE, PIDC, SCENIC, Pearson, MERLIN and Inferelator. PIDC, SCENIC, MERLIN and Pearson correlation were most stable in their performance across datasets based on F-score and AUPR.
□ IIMLP: integrated information-entropy-based method for LncRNA prediction
>> https://bmcbioinformatics.biomedcentral.com/articles/10.1186/s12859-020-03884-w
Characteristics features are extracted from the nucleic acid sequence itself, and the topological entropy and generalized topological entropy are regarded as new information theoretical features.
The features use constitute a 35-dimensional vector, which includes: 1 sequence length feature, 4 ORF, 4 Shannon entropy, 3 topological entropy, 3 generalized topology Entropy, 17 mutual information and 3 Kullback–Leibler divergence.
□ BoardION: real-time monitoring of Oxford Nanopore sequencing instruments
>> https://bmcbioinformatics.biomedcentral.com/articles/10.1186/s12859-021-04161-0
BoardION offers the possibility for sequencing platforms to remotely and simultaneously monitor all their ONT devices (MinION, Mk1C, GridION and PromethION).
BoardION’s dynamic and interactive interface allows users to explore sequencing metrics easily and to optimize in real time the quantity and the quality of the generated data by the ONT basecaller.

□ SCRaPL: hierarchical Bayesian modelling of associations in single cell multi-omics data https://www.biorxiv.org/content/10.1101/2021.05.13.443959v1.full.pdf
SCRaPL (Single Cell Regulatory Pattern Learning), a Bayesian hierarchical model to infer associations between different omics components. SCRaPL identifies a series of statistical associations between epigenomic and transcriptomic layers by addressing noise.
SCRaPL combines a latent multivariate Gaussian structure with noise models that are tailored to single cell sequencing data. Inference is implemented using a mixture of Hamiltonian Monte Carlo and Gibbs Sampler.

□ Demuxalot: scaled up genetic demultiplexing for single-cell sequencing
>> https://www.biorxiv.org/content/10.1101/2021.05.22.443646v1.full.pdf
Demuxalot, a novel and highly performant tradeoff between methods that rely on reference genotypes and methods that learn variants from the data, by selecting a small number of highly informative variants that maximize the marginal information with respect to reference SNVs.
Demuxalot’s conjugate Bayesian model smoothly integrates genotype information from reference SNVs and dataset-specific detected putative SNVs, as well as from historical experiments in a multi-batch setting.
□ DeLUCS: Deep Learning for Unsupervised Classification of DNA Sequences
>> https://www.biorxiv.org/content/10.1101/2021.05.13.444008v1.full.pdf
Deep Learning method for the Unsupervised Classification of DNA Sequences (DeLUCS), is a fully-automated method that determines cluster label assignments for its input sequences independent of any homology or same-length assumptions, and oblivious to sequence taxonomic labels.
DeLUCS uses Chaos Game Representations (CGRs) of primary
DNA sequences, and generates “mimic” sequence CGRs to self-learn data patterns (genomic signatures) through the optimization of multiple neural networks.

□ COSLIR: Direct Reconstruction of Gene Regulatory Networks underlying Cellular state Transitions without Pseudo-time Inference
>> https://www.biorxiv.org/content/10.1101/2021.05.12.443928v1.full.pdf
COSLIR (COvariance restricted Sparse LInear Regression) for directly reconstructing the gene regulatory networks (GRN) that drives the cell-state transition.
COSIR uses the alternative direction method of multipliers algorithm (ADMM) to solve this optimization problem, and apply the bootstrapping and clip thresholding for selecting significant gene-gene interactions to improve the precision and stability of the estimator.
□ MetaWorks: Profile hidden Markov model sequence analysis can help remove putative pseudogenes from DNA barcoding and metabarcoding datasets
>> https://bmcbioinformatics.biomedcentral.com/articles/10.1186/s12859-021-04180-x
it is possible to screen out apparent pseudogenes using ORF length filtering alone or combined with HMM profile analysis for greater sensitivity when pseudogene sequences contain frameshift mutations.
MetaWorks, a multi-marker metabarcode snakemake pipeline that processes paired-end Illumina reads that provides a pseudogene filtering step for protein coding markers.

□ Tejaas: reverse regression increases power for detecting trans-eQTLs
>> https://genomebiology.biomedcentral.com/articles/10.1186/s13059-021-02361-8
In forward regression (FR), they perform univariate regression of the expression level of each gene individually on the candidate SNP’s genotype (= centered minor allele frequency) and estimate whether the distribution of resulting association p values is enriched near zero.
In reverse regression, Tejaas performs L2-regularized multiple regression of the candidate SNP’s genotype jointly on all gene expression levels. Crucially, reverse regression is not negatively affected by correlations between gene expression levels.

□ IDEMAX: Inferring the experimental design for accurate gene regulatory network inference
>> https://academic.oup.com/bioinformatics/advance-article/doi/10.1093/bioinformatics/btab367/6274652
IDEMAX (Infer DEsign MAtriX) infers the effective perturbation design from gene expression data in order to eliminate the potential risk of fitting a disconnected perturbation design to gene expression.
IDEMAX is able to identify the perturbation matrix P. P is a sparse matrix of the same size as the input expression data with n non-zero values in each row, where n is the requested number of replicates for each gene.
□ IDEAS: Individual Level Differential Expression Analysis for Single Cell RNA-seq data
>> https://www.biorxiv.org/content/10.1101/2021.05.10.443350v1.full.pdf
The input data for IDEAS include gene expression data (a matrix of scRNA-seq fragment counts per gene and per cell), the variable of interest (e.g., case-control status), together with two sets of covariates.
□ Distinguishing chaotic from stochastic dynamics via the complexity of ordinal patterns
>> https://aip.scitation.org/doi/10.1063/5.0045731
The complexity measure based approaches cannot work well for short time series or discrete chaotic systems. Zunino declaimed that the presence of equalities may introduce spurious temporal correlations and thus can potentially lead to a false judgment on dynamic nature.
a new fuzzy entropy, Fuzzy Permutation Entropy (FPE), which can be used to detect determinism in time series. FPE immunes from repeated equal values in signals to some extent, especially for chaotic series.
□ LYRUS: A Machine Learning Model for Predicting the Pathogenicity of Missense Variants
>>
LYRUS, a machine learning method that uses an XGBoost classifier selected by TPOT to predict the pathogenicity of SAVs. LYRUS incorporates five sequence-based features, six structure-based features, and four dynamics-based features.

□ Hierarchical confounder discovery in the experiment–machine learning cycle
>> https://www.biorxiv.org/content/10.1101/2021.05.11.443616v1.full.pdf
a simple non-parametric statistical method called the Rank-to-Group (RTG) score that can identify hierarchical confounder effects in raw data and ML-derived data embeddings.
RTG scores correctly assign the effects of hierarchical confounders in cases where linear methods such as regression fail. RTG scores discovers cross-modal correlated variability in a complex multi-phenotypic biological dataset.
□ Sparse Allele Vectors and the Savvy Software Suite
>> https://academic.oup.com/bioinformatics/advance-article-abstract/doi/10.1093/bioinformatics/btab378/6275747
The sparse allele vectors (SAV) file format is an efficient storage format for large-scale DNA variation data and is designed for high throughput association analysis by leveraging techniques for fast deserialization of data into computer memory.
□ SSBER: removing batch effect for single-cell RNA sequencing data
>> https://bmcbioinformatics.biomedcentral.com/articles/10.1186/s12859-021-04165-w
SSBER normalizes each cell using natural logarithmic transformation method with a factor of 10,000. Next, it uses z-score transformation to standardize the expression value of each gene.
SSBER considers the partial shared cell types predicted by a cell annotation algorithm and detects mutual neighbor cell pairs among the shared cell types, which improves the accuracy of anchors. SSBER calculates correction vector for each cell with Gaussian kernel weights.

□ scHPL: Hierarchical progressive learning of cell identities in single-cell data
>> https://www.nature.com/articles/s41467-021-23196-8
scHPL, a hierarchical progressive learning method which allows continuous learning from single-cell data by leveraging the different resolutions of annotations across multiple datasets to learn and continuously update a classification tree.
scHPL adopts two alternatives to classify cells: a linear and a one-class SVM. scHPL can potentially be used to map these relations, irrespective of the assigned labels, and improve the Cell Ontology database.
□ ExTraMapper: Exon- and Transcript-level mappings for orthologous gene pairs
>> https://academic.oup.com/bioinformatics/advance-article/doi/10.1093/bioinformatics/btab393/6278896
ExTraMapper leverages sequence conservation between exons of a pair of organisms and identifies a fine-scale orthology mapping at the exon and then transcript level.
ExTraMapper identifies a larger number of exon and transcript mappings compared to previous methods. Further, it identifies exon fusions, splits, and losses due to splice site mutations, and finds mappings between microexons that are previously missed.
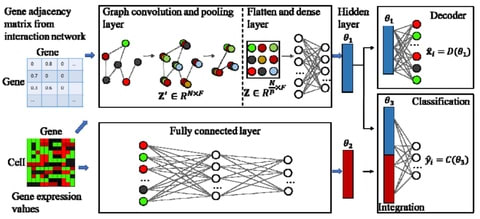
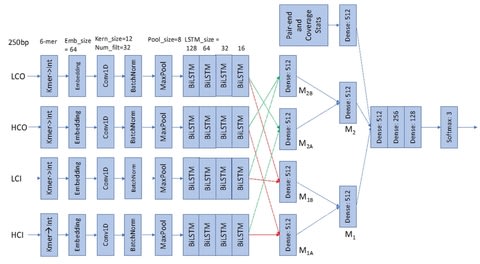
□ sigGCN: Single-Cell Classification Using Graph Convolutional Networks
>> https://www.biorxiv.org/content/10.1101/2021.06.13.448259v1.full.pdf
sigGCN, a multimodal end-to-end deep learning model for cell classification that combines a graph convolutional network (GCN) and a neural network to exploit gene interaction networks.
sigGCN employs a GCN paralleled with an NN model. Since sigGCN outputs the probability of cell class assignments, and also provides an additional function to predict a cell class as “unassigned” by setting a threshold of prediction.