□ deepSimDEF: deep neural embeddings of gene products and Gene Ontology terms for functional analysis of genes
>> https://academic.oup.com/bioinformatics/advance-article/doi/10.1093/bioinformatics/btac304/6583182
deepSimDEF, a deep learning method to automatically learn FS estimation of gene pairs given a set of genes and their GO annotations. deepSimDEF can be run in two settings: single channel considering sub-ontologies separately, and multi-channel with sub-ontologies combined.
deepSimDEF’s key novelty is its ability to learn low-dimensional embedding vector representations of GO terms and gene products, and then calculate FS using these learned vectors.

□ Statistical correction of input gradients for black box models trained with categorical input features
>> https://www.biorxiv.org/content/10.1101/2022.04.29.490102v1.full.pdf
A new source of noise in input gradients when the input features have a geometric constraint set by a probabilistic interpretation, such as one-hot-encoded DNA sequences. All data lives on a lower-dimensional manifold – a simplex within a higher-dimensional space.
This randomness can introduce unreliable gradient components in directions off the simplex, thereby affecting explanations from gradient-based attribution. A simple correction to input gradients which minimizes the impact of off-simplex-derived gradient noise.

□ eQTLsingle: Discovering single-cell eQTLs from scRNA-seq data only
>> https://www.sciencedirect.com/science/article/abs/pii/S0378111922003390
Paired sequencing technologies are still immature, and the genome coverage of current single-cell pair-sequencing data is too shallow for effective eQTL analysis. Several previous studies have shown that mutations in gene regions can be reliably detected from RNA-seq data.
eQTLsingle detects mutations from scRNA-seq data and models gene expression of different genotypes with the zero-inflated negative binomial (ZINB) model to find associations between genotypes and phenotypes at single-cell level.

□ SPCS: a spatial and pattern combined smoothing method for spatial transcriptomic expression
>> https://academic.oup.com/bib/advance-article/doi/10.1093/bib/bbac116/6563417
Spatial and Pattern Combined Smoothing (SPCS) is a novel two-factor smoothing technique, that employs k-nearest neighbor technique to utilize associations from transcriptome and Euclidean space from the Spatial Transcriptomic (ST) data.
SPCS smoothing method produces greater silhouette scores than MAGIC and SAVER. SPCS method generates a higher ARI score than existing one-factor methods, which means a more accurate histopathological parti- tion can be acquired by performing the two-factor SPCS method.

□ scGraph: a graph neural network-based approach to automatically identify cell types
>> https://academic.oup.com/bioinformatics/advance-article-abstract/doi/10.1093/bioinformatics/btac199/6565313
ScGraph is a GNN-based automatic cell identification algorithm leveraging gene interaction relationships to enhance the performance of the cell type identification.
scGraph automatically learns the gene interaction relationships from biological data and the pathway enrichment analysis shows consistent findings with previous analysis, providing insights on the analysis of regulatory mechanism.

□ RGMQL: scalable and interoperable computing of heterogeneous omics big data and metadata in R/Bioconductor
>> https://bmcbioinformatics.biomedcentral.com/articles/10.1186/s12859-022-04648-4
RGMQL is built over the GenoMetric Query Language (GMQL) data management and computational engine, and can leverage its open curated repository as well as its cloud-based resources, with the possibility of outsourcing computational tasks to GMQL remote services.
RGMQL can easily scale up from local to parallel and cloud computing while it combines and analyzes heterogeneous omics data from local or remote datasets, both public and private, in a completely transparent way to the user.

□ scROSHI - robust supervised hierarchical identification of single cells
>> https://www.biorxiv.org/content/10.1101/2022.04.05.487176v1.full.pdf
single cell Robust Supervised Hierarchical Identification of cell types (scROSHI), which utilizes a-priori defined cell type-specific gene sets and does not require training or the existence of annotated data.
scROSHI utilizes the hierarchical nature of cell identities, it can outperform its competitor when a sample contains similar cell types that derive from different branches of the lineage tree.

□ BFF and cellhashR: Analysis Tools for Accurate Demultiplexing of Cell Hashing Data
>> https://academic.oup.com/bioinformatics/advance-article-abstract/doi/10.1093/bioinformatics/btac213/6565315
Bimodal Flexible Fitting (BFF) demultiplexing algorithms BFFcluster and BFFraw, a novel class of algorithms that rely on the single inviolable assumption that barcode count distributions are bimodal.
cellhashR, a new R package that provides integrated QC and a single command to execute and compare multiple demultiplexing algorithms. BFFcluster demultiplexing is both tunable and insensitive to issues with poorly-behaved data that can confound other algorithms.

□ QuasiFlow: a bioinformatic tool for genetic variability analysis from next generation sequencing data
>> https://www.biorxiv.org/content/10.1101/2022.04.05.487169v1.full.pdf
QuasiFlow, a workflow based on well-stablished software that extracts reliable mutations and recombinations, even at low frequencies (~10^–4), provided that at least 250 million nucleotides are analysed.
To present a robust and accurate assessment of mutation and recombination frequencies, the QuasiFlow/QuasiComparer analysis must rely on the whole genetic variability, and this is clearly dependent on the number of reads for the low frequent SNVs.

□ Genotype error biases trio-based estimates of haplotype phase accuracy
>> https://www.biorxiv.org/content/10.1101/2022.04.06.487354v1.full.pdf
A method for estimating the genotype error rate from parent-offspring trios and a method for estimating the bias in the observed switch error rate that is caused by genotype error.
Genotype error inflates the observed switch error rate and that the relative bias increases with sample size. the observed switch error rate in the trio offspring is 2.4 times larger than the true switch error rate and that the average distance b/n phase errors is 64 megabases.

□ DeepPerVar: a multimodal deep learning framework for functional interpretation of genetic variants in personal genome
>> https://www.biorxiv.org/content/10.1101/2022.04.10.487809v1.full.pdf
DeepPerVar is essentially a multi-modal DNN, which considers both personal genome and personal traits, awa their interactions in the model training, to quantitatively predict epigenetic signals and evaluate the functional consequence of genetic variants on an individual level.
DeepPerVar uses the Adam algorithm to minimize the mean square error. Validation loss is evaluated at the end of each training epoch to monitor convergence. The weights of convolutional and dense layers are initialized by randomly Xavier uniform distribution.

□ BANKSY: A Spatial Omics Algorithm that Unifies Cell Type Clustering and Tissue Domain Segmentation
>> https://www.biorxiv.org/content/10.1101/2022.04.14.488259v1.full.pdf
BANKSY (Building Aggregates with a Neighbourhood Kernel and Spatial Yardstick), an algorithm that unifies cell type clustering and domain segmentation by constructing a product space of cell and neighbourhood transcriptomes, representing cell state and microen-vironment.
BANKSY can solve the distinct problems of cell type clustering and tissue domain segmentation within a unified feature augmentation framework. BANKSY is seamlessly inter-operable with the widely used bioinformatics pipelines Seurat, SingleCellExperiment, and Scanpy.

□ A spectral algorithm for polynomial-time graph isomorphism testing
>> https://www.biorxiv.org/content/10.1101/2022.04.14.488296v1.full.pdf
A spectral algorithm to infer quadratic permutations mapping tuples of isomorphic graphs in O(n^4) time. Robustness to degeneracy and multiple isomorphisms are achieved through low dimensional eigenspace projections and iterative perturbations respectively.
The graph isomorphism algortihm identified a correct solution in each experiment. Algorithmic vulnerability to numerical instability was identified in some experiments, necessitating the imposition of numerical tolerances during equality checking operations.

□ Merfin: improved variant filtering, assembly evaluation and polishing via k-mer validation
>> https://www.nature.com/articles/s41592-022-01445-y
Merfin evaluates each variant based on the expected k-mer multiplicity in the reads, independently of the quality of the read alignment and variant caller’s internal score.
Merfin increased the precision of genotyped calls, improved consensus accuracy and reduced frameshift errors when applied to human and nonhuman assemblies built from PacBio HiFi and continuous long reads or Oxford Nanopore reads, incl. the first complete human genome.

□ ScisorWiz: Visualizing Differential Isoform Expression in Single-Cell Long-Read Data
>> https://www.biorxiv.org/content/10.1101/2022.04.14.488347v1.full.pdf
ScisorWiz, a streamlined tool to visualize isoform expression differences across single-cell clusters in an informative and easily-communicable manner. ScisorWiz visualizes pre-processed single-cell long- read RNA sequencing data.
ScisorWiz generates a file for all single-cell long reads that can be inspected on the UCSC Genome Browser. ScisorWiz can be run on output generated by scisorseqr or a similarly formatted dataset, which, in turn, can be based on diverse mappers including STAR and minimap2.
< br />

□ SOAR: a spatial transcriptomics analysis resource to model spatial variability and cell type interactions
>> https://www.biorxiv.org/content/10.1101/2022.04.17.488596v1.full.pdf
SOAR (Spatial transcriptOmics Analysis Resource), an extensive and publicly accessible resource of spatial transcriptomics data. SOAR is a comprehensive database hosting a total of 1,633 samples from 132 datasets, which were uniformly processed using a standardized workflow.
SOAR provides interactive web interfaces for users to visualize spatial gene expression, evaluate gene spatial variability across cell types, and assess cell-cell interactions.

□ Read2Tree: scalable and accurate phylogenetic trees from raw reads
>> https://www.biorxiv.org/content/10.1101/2022.04.18.488678v1.full.pdf
Read2Tree, a novel approach to infer species trees, which works by directly processing raw sequencing reads into groups of corresponding genes—bypassing genome assembly, annotation, or all-versus-all sequence comparisons.
Read2Tree is able to also provide accurate trees and species comparisons using only low coverage (0.1x) data sets as well as RNA vs. genomic sequencing and operates on long or short reads.

□ Hi-LASSO: High-performance Python and Apache spark packages for feature selection with high-dimensional data
>> https://www.biorxiv.org/content/10.1101/2022.04.22.489133v1.full.pdf
High-Dimensional LASSO (Hi-LASSO) is a linear regression-based feature selection model that produces outstanding performance in both prediction and feature selection on high-dimensional data, by theoretically improving Random LASSO.
Hi-LASSO alleviates bias introduced from bootstrapping, refines importance scores, improves the performance taking advantage of global oracle property, provides a statistical strategy to determine the number of bootstrapping.

□ Statistical analysis of spatially resolved transcriptomic data by incorporating multi-omics auxiliary information
>> https://www.biorxiv.org/content/10.1101/2022.04.22.489194v1.full.pdf
OrderShapeEM is a generic multiple comparison procedure with auxiliary information that is applicable to many types of omics data. OrderShapeEM calculates the Lfdr based on an empirical Bayesian two-group mixture model.
This framework can annotate each peak with the closest gene and use the corresponding p-values as the auxiliary covariate. One caveat is that this integrative analysis is a marginal based approach and does not incorporate dependence information such as linkage disequilibrium.

□ The COPILOT Raw Illumina Genotyping QC Protocol
>> https://currentprotocols.onlinelibrary.wiley.com/doi/10.1002/cpz1.373
COPILOT (Containerised wOrkflow for Processing ILlumina genOtyping daTa.) has been successfully used to transform raw Illumina genotype intensity data into high-quality analysis-ready data that have been genotyped on a variety of Illumina genotyping arrays.
The COPILOT QC protocol consists of two distinct tandem procedures to process raw Illumina genotyping data. It automates an array of complex bioinformatics analyses to improve data quality through a secondary clustering algorithm and to automatically identify typical GWAS issues.

□ Hist2ST: Spatial Transcriptomics Prediction from Histology jointly through Transformer and Graph Neural Networks
>> https://www.biorxiv.org/content/10.1101/2022.04.25.489397v1.full.pdf
Hist2ST, a spatial information- guided deep learning method for spatial transcriptomic prediction from WSIs. Hist2ST consists of three modules: the Convmixer, Transformer, and graph neural network.
Hist2ST explicitly captures the neighborhood relationships through the graph neural network. These learned features are used to predict the gene expression by following the zero-inflated negative binomial (ZINB) distribution.

□ levioSAM2: Improved sequence mapping using a complete reference genome and lift-over
>> https://www.biorxiv.org/content/10.1101/2022.04.27.489683v1.full.pdf
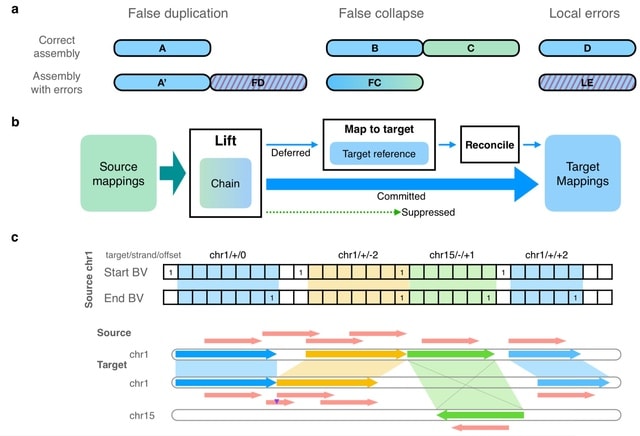
LevioSAM2 lifts mappings from a source reference to a target reference while selectively remapping the subset of reads for which lifting is not appropriate. LevioSAM2 also improved long read mapping, demonstrated by more accurate small- and structural-variant calling.
LevioSAM2 first sorts the aligned segments by position and stores them in a chain interval array, and builds a pair genome- length of succinct bit vectors. LevioSAM2 queries the chain interval array using the index and updates the contig, strand and position information.

□ scProjection: Projecting clumped transcriptomes onto single cell atlases to achieve single cell resolution
>> https://www.biorxiv.org/content/10.1101/2022.04.26.489628v1.full.pdf
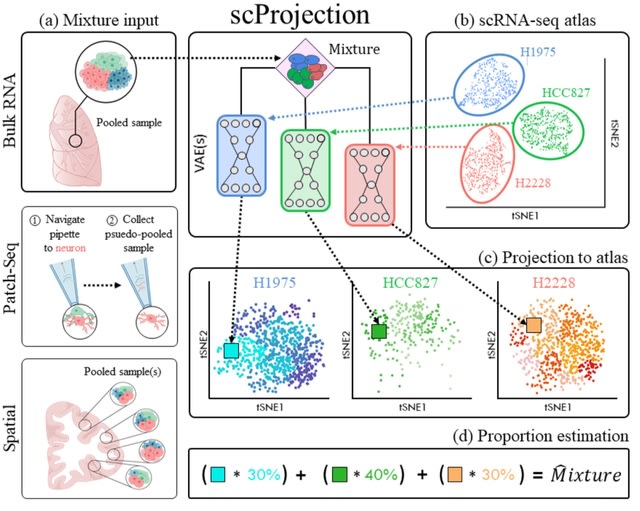
scProjection computes cell type abundance to a set of populations, its primary goal is to distinguish intra-cell type variation by mapping the RNA sample onto the precise cell state within each of the cell type populations that represents the expression profile of cell types.
scProjection uses individual variational autoencoders (VAEs) trained on each cell population within the single cell atlas to model within-cell type expression variation and delineate the landscape of valid cell states, as well as their relative occurrence.

□ HiFine: integrating Hi-c-based and shotgun-based methods to reFine binning of metagenomic contigs
>> https://academic.oup.com/bioinformatics/advance-article-abstract/doi/10.1093/bioinformatics/btac295/6575440
HiFine designs a strategy of fragmentation for the original bin sets derived from the Hi-C-based and shotgun-based binning methods, which considerably increases the purity of initial bins, followed by merging fragmented bins and recruiting unbinned contigs.

□ Methylartist: Tools for Visualising Modified Bases from Nanopore Sequence Data
>> https://academic.oup.com/bioinformatics/advance-article/doi/10.1093/bioinformatics/btac292/6575433
Methylartist, tools for analysing nanopore-derived modified base data. It is an accessible augmentation to the available tools for analysis and visualisation of nanopore-derived methylation data, incl. the non-CpG modification motifs used in chromatin footprinting assays.
The command "methylartist segmeth" aggregates methylation calls over segments into a table of tab-separated values. Category-based methylation data aggregated with "segmeth" can be plotted as strip plots, violin plots, or ridge plots using the "segplot" command.

□ GEInfo: an R package for gene-environment interaction analysis incorporating prior information
>> https://academic.oup.com/bioinformatics/advance-article-abstract/doi/10.1093/bioinformatics/btac301/6575887
Extending a “quasi-likelihood + penalization” approach to linear, logistic, and Poisson regressions. Such models are much more popular in practice.
GEInfo can incorporate prior information and is more flexible by not assuming such information is fully correct. GEInfo performs almost as well as CGEInfo and significantly outperforms GEsgMCP.

□ A Pairwise Imputation Strategy for Retaining Predictive Features When Combining Multiple Datasets
>> https://www.biorxiv.org/content/10.1101/2022.05.04.490696v1.full.pdf
A pairwise imputation method to account for differing feature sets across multiple studies when the goal is to combine information across studies to build a predictive model.
Formal notation for the general pairwise imputation framework to impute study-specific missing genes across multiple studies, as well as the specific ‘Core’ and ‘All’ imputation methods.
Both the ‘Core’ and ‘All’ imputation methods will decrease the RMSE of prediction compared to the omitting method, with ‘Core’ imputation demonstrating better performance than the ‘All’ imputation method.

□ An Entropy Approach for Choosing Gene Expression Cutoff
>> https://www.biorxiv.org/content/10.1101/2022.05.05.490711v1.full.pdf
Annotating cell types using single-cell transcriptome data usually requires binarizing the expression data to distinguish between the background noise vs. real expression or low expression vs. high expression cases.
A common approach is choosing a “reasonable” cutoff value, but it remains unclear how to choose it. A simple yet effective approach for finding this threshold value. Binarizing the data in a way that minimizes the clustering information loss.

□ scSemiAE: a deep model with semi-supervised learning for single-cell transcriptomics
>> https://bmcbioinformatics.biomedcentral.com/articles/10.1186/s12859-022-04703-0
scSemiAE aims at the identification of cell subpopulations for scRNA-seq data analysis, which leverage partial cells with labels to guide the learning of an autoencoder for the target datasets.
scSemiAE employs a classifier trained data w/ known cell type labels to annotate cell types for target datasets and selects predictions being true w/ high probability, and learns low-dimensional representations of target datasets guided by partial cells with predicted cell types.

□ Gaining insight into the allometric scaling of trees by utilizing 3d reconstructed tree models - a SimpleForest study
>>
The Reverse Branch Order (RBO) of a cylinder is the maximum depth of the subtree of the segment’s node. The RBO denotes the maximal number of branching splits of the sub-branch growing out the segment.

□ RSNET: inferring gene regulatory networks by a redundancy silencing and network enhancement technique
>> https://bmcbioinformatics.biomedcentral.com/articles/10.1186/s12859-022-04696-w
In RSNET algorithm, highly dependent nodes are constrained in the model as network enhancement items to enhance real interactions and dimension of putative interactions is reduced adaptively to remove weak and indirect connections.
The network inferred by RSNET method is a directed network. RSNET can identify the direct causal genes by filtering out the indirect and noisy genes. RSNET combines both linear and nonlinear interactions overcomes the drawback of linear or nonlinear methods.

□ Depth normalization for single-cell genomics count data
>> https://www.biorxiv.org/content/10.1101/2022.05.06.490859v1.full.pdf
A monotonic transform on the raw counts that results in a fully depth normalized matrix and offers variance stability similar to sqrt. Depth normalization was assessed by plotting, for each cell, the total raw cell counts vs. the total transformed cell counts.

□ SPINNAKER: an R-based tool to highlight key RNA interactions in complex biological networks
>> https://bmcbioinformatics.biomedcentral.com/articles/10.1186/s12859-022-04695-x
SPINNAKER (SPongeINteractionNetworkmAKER) the open-source version of their widely established mathematical model for predicting ceRNAs crosstalk, that is released as an exhaustive collection of R functions.
SPINNAKER applies a logarithmic (log2) transformation to the RNAs and miRNAs expression levels and conducts a processing analysis to remove those genes having too many missing values among the samples, and computes the Pearson correlation coefficient with miRNAs.

□ iFeatureOmega: an integrative platform for engineering, visualization and analysis of features from molecular sequences, structural and ligand data sets
>> https://academic.oup.com/nar/advance-article/doi/10.1093/nar/gkac351/6582173
iFeatureOmega supplies the largest number of feature extraction and analysis approaches for most molecule types compared to other pipelines. It integrates 15 feature analysis methods incl. ten clustering, three dimensionality reduction and two feature normalization algorithms.
iFeatureOmega covers six correlation and covariance measures for individual amino acid sequences, summarized in the ‘autocorrelations’ category. Two sequence order-based features can also be calculated by iFeatureOmega in the ‘quasi-sequence-order’ category.

□ Sparse sliced inverse regression for high dimensional data analysis
>> https://bmcbioinformatics.biomedcentral.com/articles/10.1186/s12859-022-04700-3
Obtaining sparse estimates of the eigenvectors that constitute the basis matrix that is used to construct the indices is desirable to facilitate variable selection, which in turn facilitates interpretability and model parsimony.
A convex formulation that produces simultaneous dimension reduction and variable selection. A group-Dantzig selector type formulation that induces row-sparsity to the sliced inverse regression dimension reduction vectors.


※コメント投稿者のブログIDはブログ作成者のみに通知されます