 (designed by Pak)
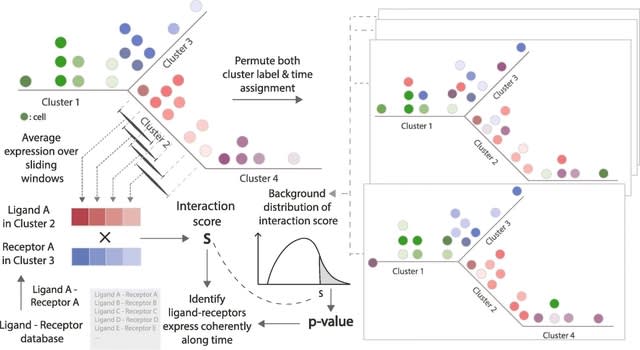
□ TraSig: inferring cell-cell interactions from pseudotime ordering of scRNA-Seq data
>> https://genomebiology.biomedcentral.com/articles/10.1186/s13059-022-02629-7
TraSig (Trajectory-based Signalling genes inference) takes the pseudo-time ordering for each group and the expression of genes along the trajectory as input and then outputs an interaction score and p-value for each possible ligand-receptor pair.
TraSig uses the Continuous-State Hidden Markov Model (CSHMM). learns a generative model on the expression data using transition states and emission probabilities. CSHMM assumes a tree structure for the trajectory and assigns cells to specific locations on its edges.
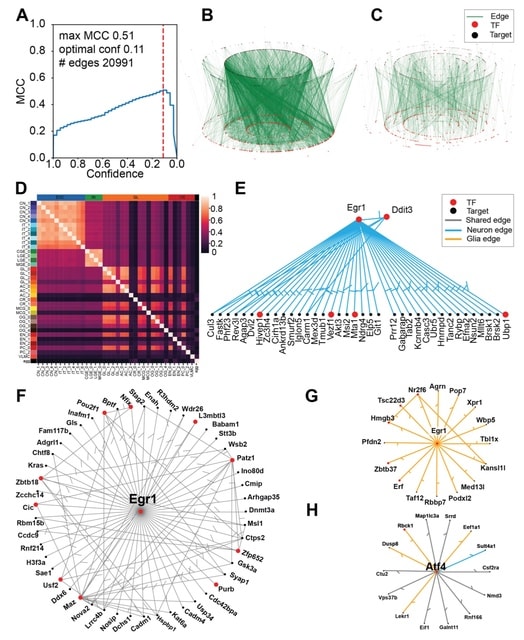
□ The Inferelator 3.0: High performance single-cell gene regulatory network inference at scale
>> https://academic.oup.com/bioinformatics/advance-article/doi/10.1093/bioinformatics/btac117/6533443
The Inferelator 3.0 pipeline for single-cell GRN inference, based on regularized regression. This pipeline calculates TF activity using a prior knowledge network and regresses scRNAseq expression data against that activity estimate to learn new regulatory edges.
The inferelator 3.0 uses TF motif position-weight matrices to score TF binding within gene regulatory regions and build sparse prior networks. It is able to distribute work across multiple computational nodes, allowing networks to be rapidly learned from over 10^5 cells.
□ Flow-GTED: The Effect of Genome Graph Expressiveness on the Discrepancy Between Genome Graph Distance and String Set Distance
>> https://www.biorxiv.org/content/10.1101/2022.02.18.481102v1.full.pdf
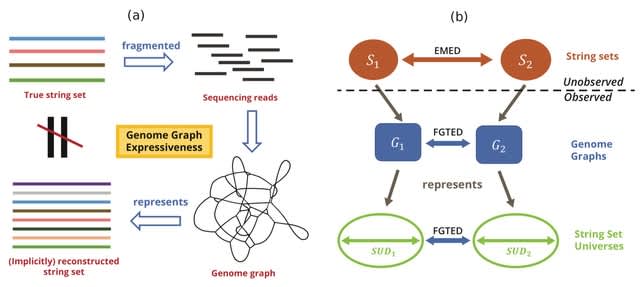
Extending a genome graph distance metric, Graph Traversal Edit Distance (GTED) to FGTED to model the distance between heterogeneous string sets and show that GTED and FGTED always underestimate the Earth Mover’s Edit Distance (EMED) between string sets.
FGTED always produces a distance that is larger than or equal to GTED, and that FGTED computes a metric that is always less than or equal to the EMED between true sets of strings.
Define the collection of strings that can be represented by the genome graph as its string set universe, and genome graph expressiveness as the diameter of its string set universe (SUD), which is the maximum EMED between two string sets that can be represented by the graph.
Flow-GTED denotes the distance computed using the alignment graph after removing all infinity cost edges that forbid aligning the sink with any nodes other than the source node.
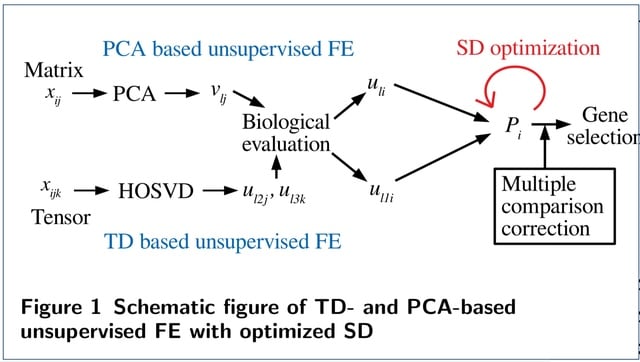
□ Tensor decomposition- and principal component analysis-based unsupervised feature extraction to select more reasonable differentially expressed genes: Optimization of standard deviation versus state-of-art methods
>> https://www.biorxiv.org/content/10.1101/2022.02.18.481115v1.full.pdf
Optimizing the standard deviation such that the histogram of P-values is as much as possible coincident with the null hypothesis results in an increase in the number and biological reliability of the selected genes.
One of the striking features is that DEGs with lesser gene expression are less likely recognized even with the same LFC, if the genes are selected by TD- and PCA-based unsupervised FE with optimized SD.
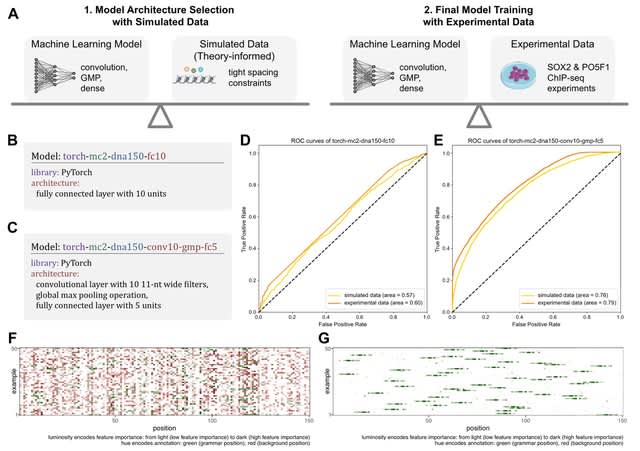
□ seqgra: Principled Selection of Neural Network Architectures for Genomics Prediction Tasks
>> https://academic.oup.com/bioinformatics/advance-article/doi/10.1093/bioinformatics/btac101/6534325
seqgra, a deep learning pipeline that incorporates the rule-based simulation of biological sequence data and the training and evaluation of models, whose decision boundaries mirror the rules from the simulation process.
seqgra creates models based on a precise description of their architecture, loss, optimizer, and training process, and evaluate the trained models using conventional test set metrics as well as an array of feature attribution methods.
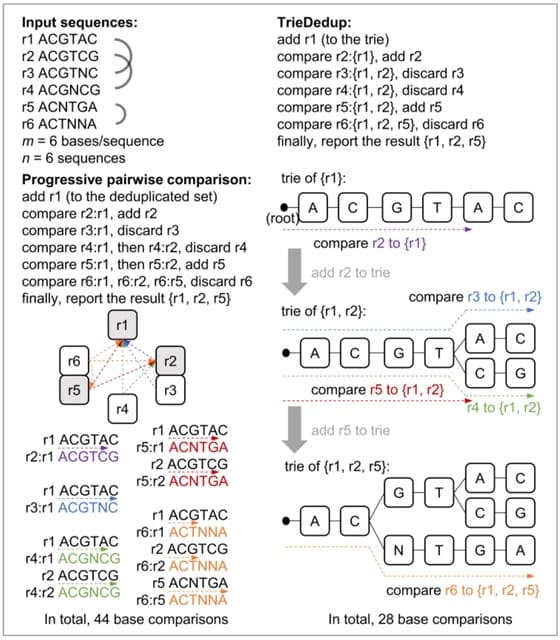
□ TrieDedup: A fast trie-based deduplication algorithm to handle ambiguous bases in high-throughput sequencing
>> https://www.biorxiv.org/content/10.1101/2022.02.20.481170v1.full.pdf
Suppose there are n input sequences, and each sequence has m bases. For the preprocessing steps, the time complexity of counting 'N's is O(m×n), and sorting n sequences can be O(n×log(n)) for quick sort, or O(n) for bucket sort.
TrieDedup uses trie (prefix tree) structure to compare and store sequences. TrieDedup can handle ambiguous base 'N's, and efficiently deduplicate at the level of raw sequences.
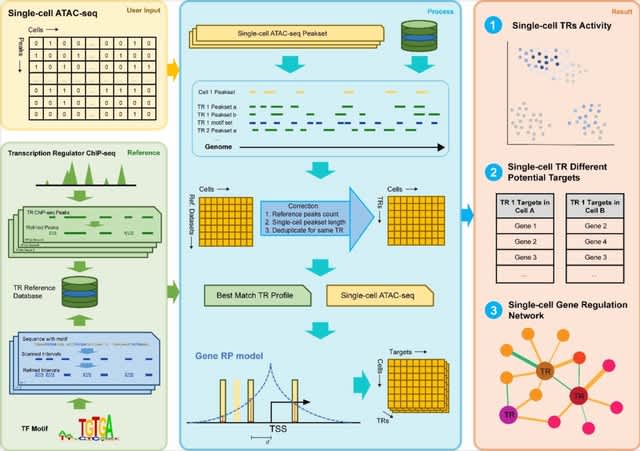
□ SCRIP: Single-cell Gene Regulation Network Interference by Large-scale Data Integration
>> https://www.biorxiv.org/content/10.1101/2022.02.19.481131v1.full.pdf
SCRIP, an integrative method to infer single-cell TR activities and targets based on the integration of scATAC-seq and public bulk ChIP-seq datasets.
The SCRIP takes the scATAC-seq peak by count matrix or bin count matrix as input. SCRIP allows identifying the targets of different TRs in diverse cell types and constructing GRNs of multiple TRs in the same cell.
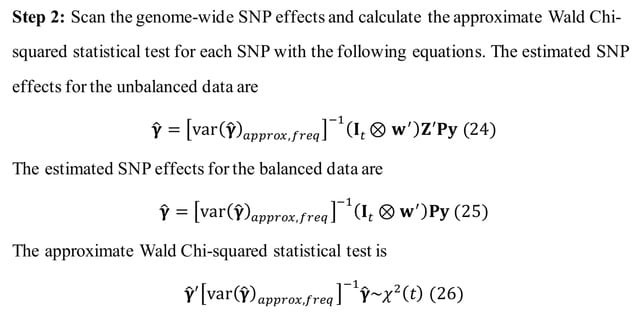
□ GMAT: An Improved Linear Mixed Model for Multivariate Genome-Wide Association Studies
>> https://www.biorxiv.org/content/10.1101/2022.02.21.481252v1.full.pdf
GMAT, can handle incomplete multivariate data with missing records and reduce the time complexity to O(n) per SNP.
GMAT has increased the statistical power with a proper control of false positivity for association studies compared to the conventional linear mixed model (LMM) that removes individuals with incomplete records.
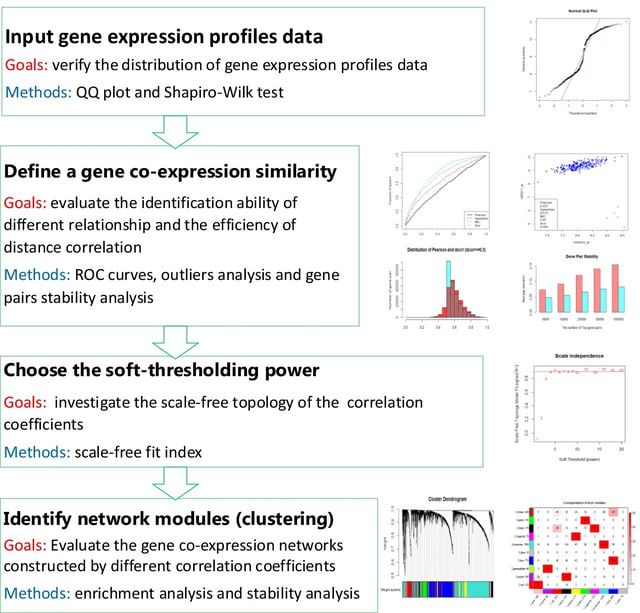
□ Distance correlation application to gene co-expression network analysis
>> https://bmcbioinformatics.biomedcentral.com/articles/10.1186/s12859-022-04609-x
a correlation metric integrating both linear and non-linear dependence, with other three typical metrics (Pearson’s correlation, Spearman’s correlation, and maximal information coefficient) on four different arrays and RNA-seq datasets.
Incorporated distance correlation into WGCNA to construct a distance correlation-based WGCNA (DC-WGCNA) algorithm for gene co-expression analysis.
In DC-WGCNA, the correlation coefficients between the gene expression profiling data are calculated by distance correlation, and the other process of DC-WGCNA is identical to the traditional WGCNA except for the different correlation coefficients.
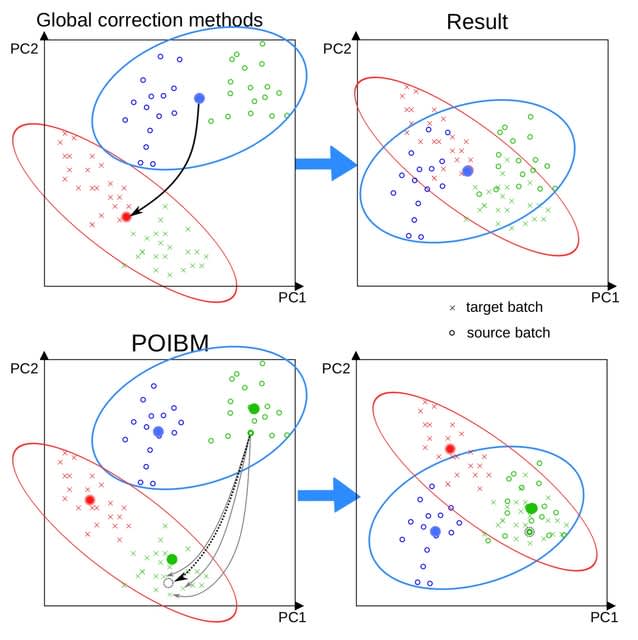
□ POIBM: Batch correction of heterogeneous RNA-seq datasets through latent sample matching
>> https://academic.oup.com/bioinformatics/advance-article/doi/10.1093/bioinformatics/btac124/6535232
a POIsson Batch correction through sample Matching (POIBM), which is based on an idea of inferring virtual reference samples from the data. Consequently, special experimental designs or design factors are not required since POIBM automatically learns these from the data.
POIBM utilizes only two expression matrices of read counts, a target matrix and a source matrix. POIBM is designed to be optimal for RNA-seq count data, similar to ComBat-seq, which has been shown to outperform the Gaussian alternatives on RNA-seq data.
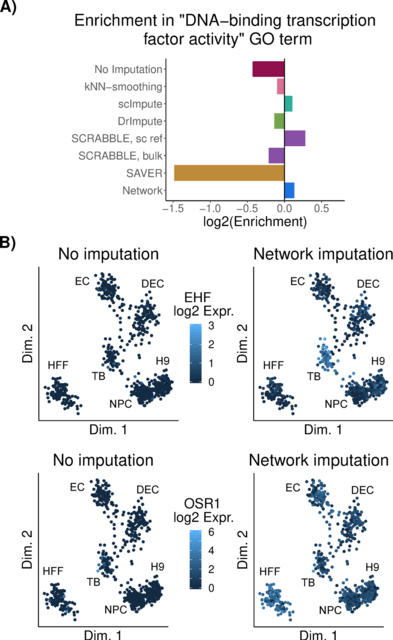
□ Regulatory network-based imputation of dropouts in single-cell RNA sequencing data
>> https://journals.plos.org/ploscompbiol/article?id=10.1371/journal.pcbi.1009849
The simple explanation estimates the average using all cells is a much more robust estimator of the true mean than using only a small set of similar cells, especially when the gene was detected in only few cells and/or if the gene’s expression does not vary much across cells.
This imputes missing states of genes in cases where the respective gene was not detected in any cell or in only extremely few cells. This approach rests on the assumption that the network describes the true regulatory relationships in the cells at hand with sufficient accuracy.
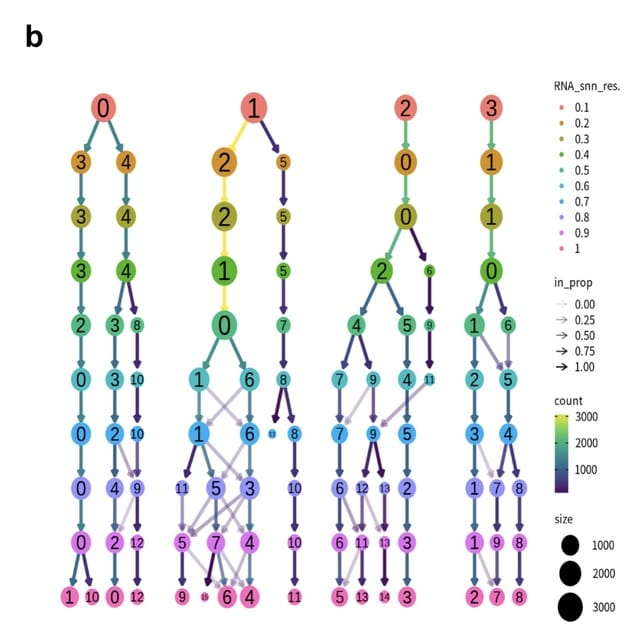
□ SEQUIN: rapid and reproducible analysis of RNA-seq data in R/Shiny
>> https://www.biorxiv.org/content/10.1101/2022.02.23.481646v1.full.pdf
SEQUIN is guided by the NIH principles of scientific data management (findability, accessibility, interoperability, reusability). SEQUIN is a R/Shiny app for real- time analysis and visualization of bulk and scRNA-seq raw count and metadata.
SEQUIN empowers users with different backgrounds to perform customizable analysis of bulk and single-cell RNA-seq in real-time and in one location.
□ BamToCov: an efficient toolkit for sequence coverage calculations
>> https://academic.oup.com/bioinformatics/advance-article/doi/10.1093/bioinformatics/btac125/6535233
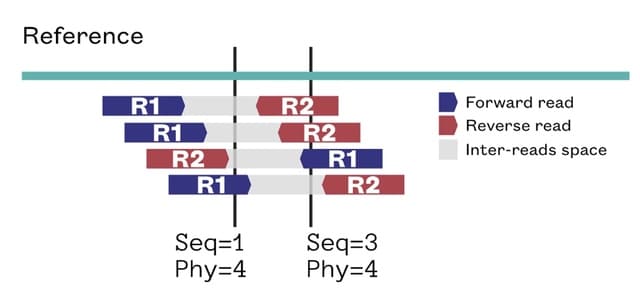
BamToCov performs coverage calculations using an optimized implementation of the algorithm of Covtobed with new features to support interval targets, new output formats, coverage statistics and multiple BAM files, while retaining the ability to read input streams.
BamToCov uses a streaming approach that takes full advantage of sorted input alignments. Furthermore, its memory usage depends only on the maximum coverage and not on the reference size. BamToCov proves to be a suitable alternative for gene panels and long reads datasets.
□ monaLisa: an R/Bioconductor package for identifying regulatory motifs
>> https://academic.oup.com/bioinformatics/advance-article/doi/10.1093/bioinformatics/btac102/6535228
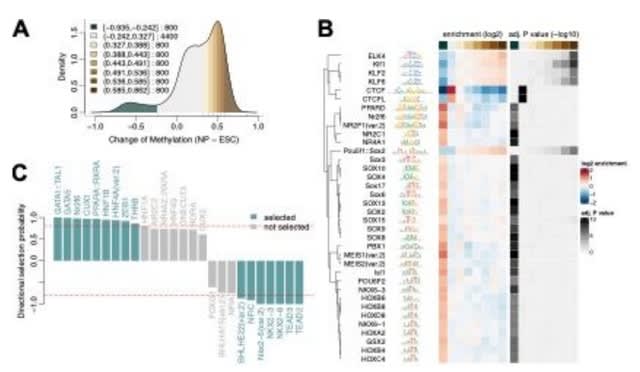
monaLisa: MOtif aNAlysis with Lisa was inspired by her father Homer to look for enriched motifs in sets (bins) of genomic regions, compared to all other regions ("binned motif enrichment analysis").
The regions are for example promoters or accessible regions, which are grouped into bins according to a numerical value assigned to each region, such as change of expression or accessibility.
□ Truvari: Refined Structural Variant Comparison Preserves Allelic Diversity
>> https://www.biorxiv.org/content/10.1101/2022.02.21.481353v1.full.pdf
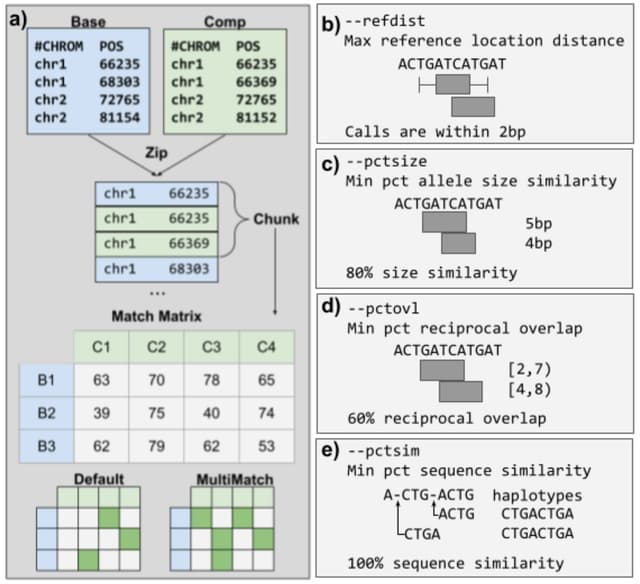
Truvari - a SV comparison, annotation and analysis toolkit - and demonstrate the effect of SV comparison choices by building population-level VCFs from 36 haplotype-resolved long-read assemblies.
When SV comparison is too lenient, over-merging occurs, distinct alleles are lost, and metrics such as allele frequency are inflated. Truvari’s core functionality involves building a matrix of pairs of SVs and ordering the pairs to determine how each should be handled.

□ xcore: an R package for inference of gene expression regulators
>> https://www.biorxiv.org/content/10.1101/2022.02.23.481130v1.full.pdf
xcore takes promoter or gene expression counts matrix as input, the data is then filtered for lowly expressed features, normalized for the library size and transformed into counts per million (CPM) using edgeR.
Using ridge regression xcore models changes in expression as a linear combination of molecular signatures in an attempt to find their unknown activities.
□ EagleImp-Web: A Fast and Secure Genotype Phasing and Imputation Web Service using Field-Programmable Gate Arrays
>> https://www.biorxiv.org/content/10.1101/2022.02.24.481790v1.full.pdf
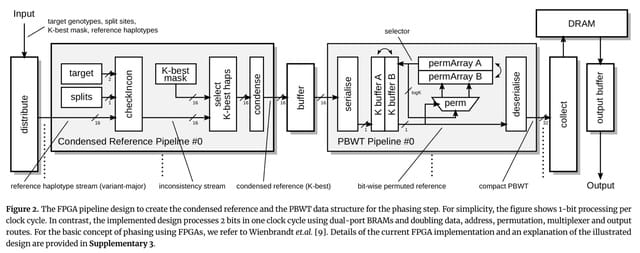
EagleImp-Web uses technical improvements in phasing and imputation algorithms and a field-programmable gate array (FPGA) accelerator design to reduce computation time without loss of phasing and imputation quality.
The main advantages of EagleImp over the classical two step approach with Eagle2 and PBWT are the increased computation speed of a factor 2 to 10 while the phasing and imputation quality is at least maintained or even improved.
□ DRDNet: A statistical framework for recovering pseudo-dynamic networks from static data
>> https://academic.oup.com/bioinformatics/advance-article-abstract/doi/10.1093/bioinformatics/btac038/6537533
DRDNet incorporates a varying coefficient model with multiple ordinary differential equations to learn a series of networks.
Since DRDNet is under the philosophy of prediction, where interaction effects from each node are assumed to be unknown and modeled nonparametrically.
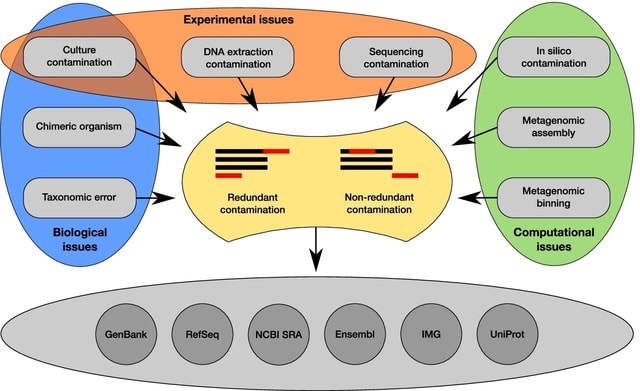
□ Contamination detection in genomic data: more is not enough
>> https://genomebiology.biomedcentral.com/articles/10.1186/s13059-022-02619-9
The algorithms can be divided into two main categories, depending on if they are database-free or, in opposition, if they rely on a reference database. The second category contains two different types of tools: genome-wide approaches and estimators based on single-copy gene markers.
The most frequent rationale for using multiple approaches is to increase the sensitivity and catch more contaminated genomes by considering the union of the methods. This is especially useful in large genomic projects where the loss of individual genomes is not too important.
□ Hanna Liubakova RT
#Ukraine
Residents of Energodar took to the streets to prevent Russian troops. In this city, the largest nuclear power plant in Europe - the Zaporizhzhia Nuclear Power Station - is located. Any shelling or explosion can be deadly here. I hope the Kremlin understands it
>>
□ stavridisj RT
History being made in so many ways right in front of our eyes. As Supreme Allied Commander of NATO for 4 years, I never considered use of these “war reserve” equipment.
>> https://www.armytimes.com/flashpoints/2022/03/01/army-activates-prepositioned-stocks-for-first-time-in-wake-of-ukraine-invasion/
>> https://twitter.com/stavridisj/status/1499013500630413321?s=21
□ Victore Kovalenko RT
During the 5th day of war, the #Ukrainian air defense is actively engaging, and functional. In this video you can see how it intercepts the Russian missile in the sky between #Melipotol city and Vasilyevka settlement on the south. pic.twitter.com/iC5yCBtvGU #Ukraine
>> https://twitter.com/mrkovalenko/status/1498374524819189764?s=21
□ GEORGIA RT
>> https://twitter.com/tbilisime/status/1498439504696328192?s=21
Stay Strong Ukraine!🇺🇦 We pray for you!
#staystrongUkraine
Вся Грузия объединилась в поддержку Украины.
Люди здесь выходят каждый день с начала этого ада.
Video🎥 Spitfire Media

□ The SETI Institute RT
>> https://twitter.com/setiinstitute/status/1498409435714174976?s=21
The U.S. and Russia have cooperated extensively in building and operating the @Space_Station since 1993. @esa, @JAXA_en, and @csa_asc have played major roles, but that deep cooperation is failing. Will Western sanctions end joint programs? buff.ly/3M24frb @NExSSManyWorlds
□ NFDI-de RT
>> https://twitter.com/nfdi_de/status/1498670920545849347?s=21
As a large network of research institutions in Germany, #NFDI is collecting links, contacts and services that can help scientists from Ukraine affected by the war. We hope that we can show our solidarity this way. #ScienceForUkraine @Sci_for_Ukraine
https://www.nfdi.de/important-links-for-scientists-from-ukraine/?lang=en
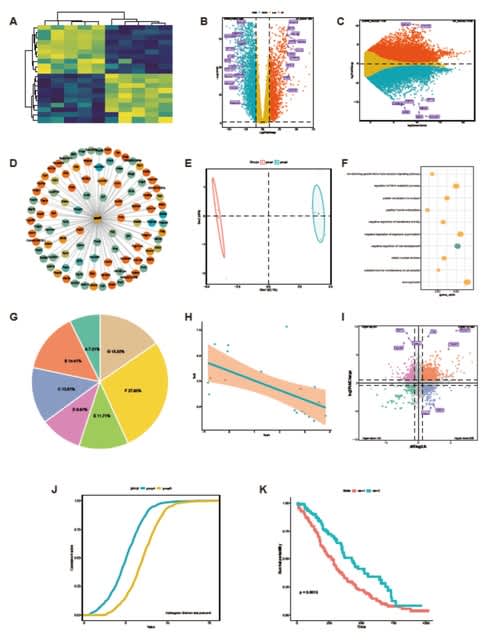
□ GraphBio: a shiny web app to easily perform popular visualization analysis for omics data
>> https://www.biorxiv.org/content/10.1101/2022.02.28.482106v1.full.pdf
GraphBio provides 15 modules, incl. heatmap, volcano plots, MA plots, network plots, dot plots, chord plots, pie plots, four quadrant diagrams, venn diagrams, cumulative distribution curves, PCA, survival analysis, ROC analysis, correlation analysis and text cluster analysis.
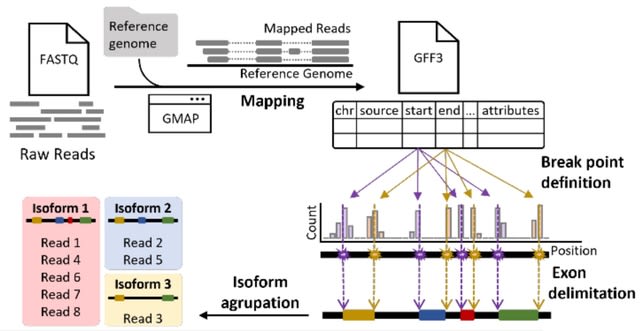
□ Mini-IsoQLR: a pipeline for isoform quantification using long-reads sequencing data for single locus analysis
>> https://www.biorxiv.org/content/10.1101/2022.03.01.482488v1.full.pdf
Mini-IsoQLR was developed to detect and quantify isoforms from the expression of minigenes, whose cDNA was sequenced using Oxford Nanopore Technologies (ONT).
This protocol uses GMAP aligner, which aligns cDNA sequences to a genome, using the parameter --format=2 which generates a GFF3 file which contains the coordinates of the exons from all reads. Using this information, Mini-IsoQLR.R classify the mapped reads into isoforms.
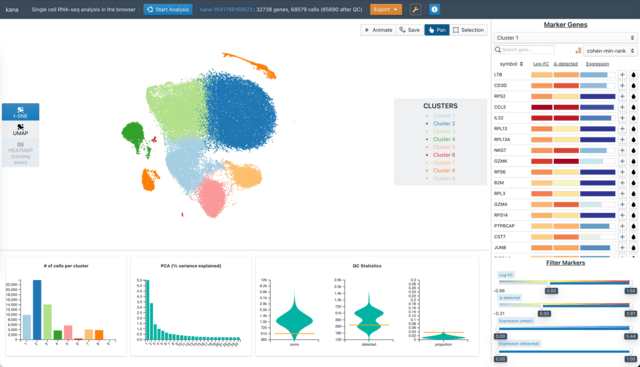
□ kana: Single-cell data analysis in the browser
>> https://www.biorxiv.org/content/10.1101/2022.03.02.482701v1.full.pdf
kana provides a streamlined one-click workflow for all steps in a typical scRNA-seq analysis, starting from a count matrix and finishing with marker detection.
Users can interactively explore the low- dimensional embeddings, clusterings and marker genes in an intuitive graphical interface that encourages iterative re-analysis.
□ Nanopore quality score resolution can be reduced with little effect on downstream analysis
>> https://www.biorxiv.org/content/10.1101/2022.03.03.482048v1.full.pdf
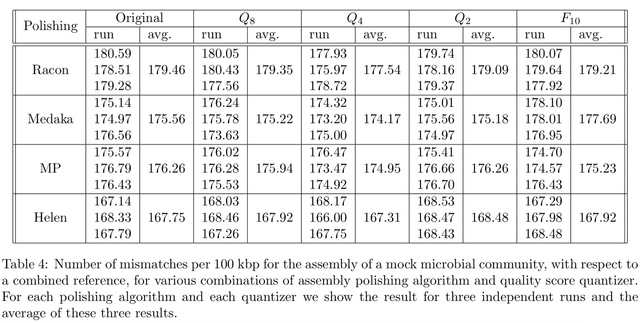
The experiments on various usage scenarios for nanopore sequencing data, including different applications and coverage levels, show that the precision that is currently used for quality scores is unnecessarily high.
All these results were obtained with applications as they are provided, with no special tuning or training for quantized quality scores.
Although such specific tuning may improve the performance of these applications (for example through neural network retraining), the matter of fact is that excelent results are obtained with no software adjustment.
The quantization of quality scores results in large storage space savings, even using a general purpose compressor such as gzip.
□ CNVind: an open source cloud-based pipeline for rare CNVs detection in whole exome sequencing data based on the depth of coverage
>> https://bmcbioinformatics.biomedcentral.com/articles/10.1186/s12859-022-04617-x
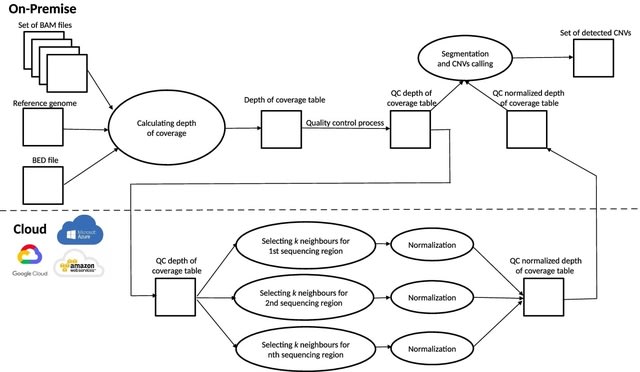
CNVind performs n independent depth of coverage normalizations. Before each normalization, the application selects the k most correlated sequencing regions with the depth of coverage Pearson’s Correlation as distance metric.
Then, the resulting subgroup of k+1 sequencing regions is normalized, the results of all n independent normalizations are combined; finally, the segmentation and CNV calling process is performed on the resultant dataset.
□ supCPM: Supervised Capacity Preserving Mapping: A Clustering Guided Visualization Method for scRNAseq data
>> https://academic.oup.com/bioinformatics/advance-article/doi/10.1093/bioinformatics/btac131/6543606
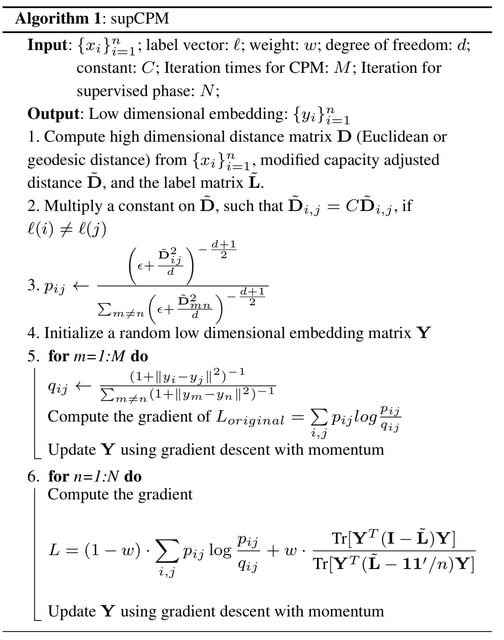
supCPM, a robust supervised visualization method, which separates different clusters, preserves the global structure and tracks the cluster variance.
Continuous scRNAseq data often exhibits trajectories where functional overlaps occur. This real world challenge could limit effectiveness of supCPM, because the second optimization part separates different clusters far apart.
One could think of how to process the dataset with the mixture of both discrete and continuous cell types. supCPM shows improved performance than other methods in preserving the global geometric structure and data variance.
□ JIND: Joint Integration and Discrimination for Automated Single-Cell Annotation
>> https://academic.oup.com/bioinformatics/advance-article/doi/10.1093/bioinformatics/btac140/6543609
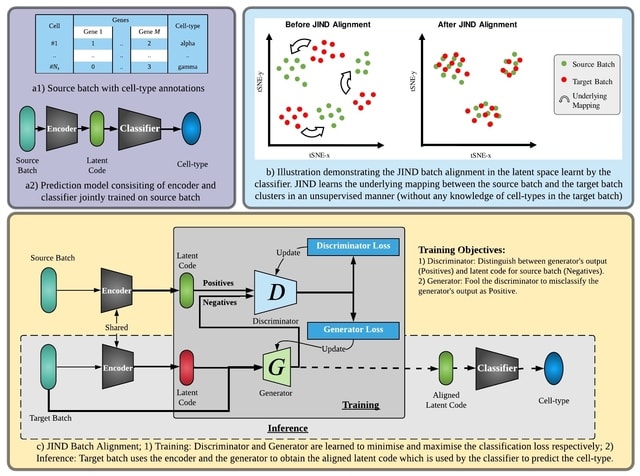
JIND is a framework for automated cell-type identification based on neural networks. It directly learns a low-dimensional representation (latent code) inwhich cell-types can be reliably determined.
JIND performs a novel asymmetric alignment in which the transcriptomic profileof unseen cells is mapped onto the previously learned latent space, hence avoiding the need of retraining the model whenever a new dataset becomes available.
The NN used by JIND consists of two subnetworks, an encoder and a classifier. First, the encoder network maps the input gene expression vector onto a 256-dimensional latent space via a one-layer NN.
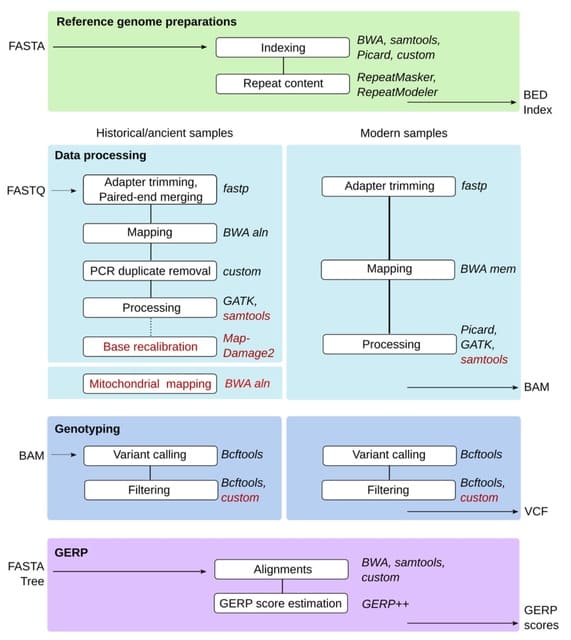
□ GenErode: a bioinformatics pipeline to investigate genome erosion in endangered and extinct species
>> https://www.biorxiv.org/content/10.1101/2022.03.04.482637v1.full.pdf
GenErode aims to produce comparable estimates of genomic diversity indices from temporally sampled datasets that can be used to quantify genomic erosion through time.
GenErode requires only a reference genome assembly and whole-genome re-sequencing data. GenErode offers two complementary methods to estimate mutational load, a proxy for genetic load, from the genomic data of the samples analyzed.

□ vissE: A versatile tool to identify and visualise higher-order molecular phenotypes from functional enrichment analysis
>> https://www.biorxiv.org/content/10.1101/2022.03.06.483195v1.full.pdf
vissE, a flexible network-based analysis method that summarises redundancies into biological themes and provides various analytical modules to characterise and visualise them with respect to the underlying data, thus providing a comprehensive view of the biological system.
The vissE method tackles gene-set redundancy by condensing information from all significant gene-sets into higher-order biological processes, thus hierarchically structuring the results in an easily browsable manner.

□ iPheGWAS : an intelligent computational framework to integrate and visualise genome-phenome wide association studies
>> https://www.biorxiv.org/content/10.1101/2022.03.05.483121v1.full.pdf
Since iPheGWAS provides an ordered or clustered visualisation of multiple traits that are genetically similar, an easy visual appreciation of the overall genome-wide landscape provides initial clues about shared genetic effects across multiple phenotypes.
iPheGWAS assists the process of selecting traits for a multi-trait analysis genome-wide association studies (MTAG) to improve power for detecting genetic variants contributing to disease risk.

□ NewWave: a scalable R/Bioconductor package for the dimensionality reduction and batch effect removal of single-cell RNA-seq data
>> https://academic.oup.com/bioinformatics/advance-article/doi/10.1093/bioinformatics/btac149/6546285
ZINB-WaVE uses a zero inflated negative binomial model to find biologically meaningful latent factors. Optionally, the model can remove batch effects and other confounding variables, leading to a low-dimensional representation that focuses on biological differences among cells.
NewWave allows users to massively parallelize computations using PSOCK clusters. NewWave is able to achieve the same, or even better, performance of ZINB-WaVE at a fraction of the computational speed and memory usage, reducing the runtime by 90% with respect to ZINB-WaVE.


※コメント投稿者のブログIDはブログ作成者のみに通知されます