
□ DARDN: Identifying transcription factor binding motifs from long DNA sequences using multi-CNNs and DeepLIFT
>> https://www.biorxiv.org/content/10.1101/2023.11.17.567502v1
DARDN (DNAResDualNet), a computational method that utilizes convolutional neural networks (CNNs) coupled with feature discovery using DeepLIFT, for identifying DNA sequence features that can differentiate two sets of lengthy DNA sequences.
DARDN employs two CNNs with distinct initial kernel sizes for DNA sequence classification and residual connections in it to preserve complex relationships between distant DNA sequences. DARDN computes the binary cross entropy (BCE) loss between the predicted probability.

□ Lamian: A statistical framework for differential pseudotime analysis with multiple single-cell RNA-seq samples
>> https://www.nature.com/articles/s41467-023-42841-y
Lamian uses the harmonized data to construct a pseudotemporal trajectory and then quantifies the uncertainty of tree branches using bootstrap resampling. The cluster-based minimum spanning tree (cMST) approach described in TSCAN is used to construct a pseudotemporal trajectory.
Lamian will automatically enumerate all pseudotemporal paths and branches. Lamian first identifies variation in tree topology across samples and then assesses if there are differential topological changes associated with sample covariates.
Lamian estimates tree topology stability and accurately detects differential tree topology. Lamian uses repeated bootstrap sampling of cells along the branches to calculate a detection rate. Lamian comprehensively detects differential pseudotemporal GE and cell density.

□ GraphHiC: Improving Hi-C contact matrices using genome graphs
>> https://www.biorxiv.org/content/10.1101/2023.11.08.566275v1
A novel problem objective to formalize the inference problem. They choose the best source-to-sink path in the directed acyclic graph that optimizes the confidence of TAD infer. Optimizing the objective is NP-complete, a complexity that persists even w/ directed acyclic graphs.
A novel greedy heuristic for the problem and theoretically show that, under a set of relaxed assumptions, the heuristic finds the optimal path with a high probability. They also develop the first complete graph-based Hi-C processing pipeline.


□ GraphTar: applying word2vec and graph neural networks to miRNA target prediction
>> https://bmcbioinformatics.biomedcentral.com/articles/10.1186/s12859-023-05564-x
GraphTar, a new target prediction method that uses a novel graph-based representation to reflect the spatial structure of the miRNA–mRNA duplex. Unlike existing approaches, GraphTar uses the word2vec method to accurately encode RNA sequence information.
GraphTar use a graph neural network classifier that can accurately predict miRNA–mRNA interactions based on graph representation learning. GraphTar segments the sequences of both the mRNA and miRNA’s Minimal Binding Site (MBS) into triplets.

□ RNAkinet: Deep learning and direct sequencing of labeled RNA captures transcriptome dynamics
>> https://www.biorxiv.org/content/10.1101/2023.11.17.567581v1
RNAkinet, a computationally efficient, convolutional, and recurrent neural network (NN) that identifies individual 5EU-modified RNA molecules following direct RNA-Seq.
RNAkinet generalizes to sequences from unique experimental settings, cell types, and species and accurately quantifies RNA kinetic parameters, from single time point experiments.
RNAkinet can analyze entire experiments in hours, instead of days that nano-ID does, and predicts the modification status of RNA molecules directly from the raw nanopore signal without using basecalling or reference sequence alignment.

□ Med-PaLM 2: Genetic Discovery Enabled by A Large Language Model
>> https://www.biorxiv.org/content/10.1101/2023.11.09.566468v1
Med-PaLM 2 is a recently developed medically aligned LLM that was fine-tuned using high quality biomedical text corpora and was aligned using clinician feedback.
Despite these advances and the large volume of biomedical and scientific knowledge encoded within LLMs, it remains to be determined if LLMs can be used to generate novel hypotheses that facilitate genetic discovery.
Med-PaLM uncovers gene-phenotype associations. It correctly responded to free-text queries about potential sets of candidate genes and that it could identify a novel causative genetic factor for an important biomedical trait.

□ ESICCC as a systematic computational framework for evaluation, selection, and integration of cell-cell communication inference methods
>> https://genome.cshlp.org/content/33/10/1788.full
ESICCC, a systematic benchmark framework to evaluate 18 ligand-receptor (LR) inference methods and five ligand/receptor-target inference methods.
Regarding accuracy evaluation, RNAMagnet, CellChat, and scSeqComm emerge as the three best-performing methods for intercellular ligand-receptor inference based on scRNA-seq data, whereas stMLnet and HoloNet are the best methods for predicting ligand/receptor-target regulation.

□ EPIK: Precise and scalable evolutionary placement with informative k-mers
>> https://academic.oup.com/bioinformatics/advance-article/doi/10.1093/bioinformatics/btad692/7425449
IPK (Inference of Phylo-K-mers), a tool for efficient computation of phylo-k-mers. IPK improves the running times of the phylo-k-mer construction step by up to two orders of magnitude. It reduces large phylo-k-mer collections with little or no loss in placement accuracy.
EPIK (Evolutionary Placement with Informative K-mers), an optimized parallel implementation of placement with filtered phylo-k-mers. EPIK substantially outperforms its predecessor. EPIK can place millions of short queries on a single thread in a matter of minutes or hours.

□ syntenyPlotteR: a user-friendly R package to visualize genome synteny, ideal for both experienced and novice bioinformaticians
>> https://academic.oup.com/bioinformaticsadvances/advance-article/doi/10.1093/bioadv/vbad161/7382206
syntenyPlotteR, an R package specifically designed to plot syntenic relationships between genomes, allowing the clear identification of both inter- and intra-chromosomal rearrangements.
As with the Evolution Highway plots, regions that either do not align or were not assembled in the comparative species are depicted as uncoloured regions of the reference chromosomes.

□ BELMM: Bayesian model selection and random walk smoothing in time-series clustering
>> https://academic.oup.com/bioinformatics/advance-article/doi/10.1093/bioinformatics/btad686/7420213
BELMM (Bayesian Estimation of Latent Mixture Models): a flexible framework for analyzing, clustering, and modelling time-series data in a Bayesian setting. The framework is built on mixture modelling.
BELMM is based on the most plausible model and the number of mixture components using the Reversible-jump Markov chain Monte Carlo. It assigns the time series into clusters based on the similarity to the cluster-specific trend curves determined by the latent random walk process.

□ EMVC-2: An efficient single-nucleotide variant caller based on expectation maximization
>> https://academic.oup.com/bioinformatics/advance-article/doi/10.1093/bioinformatics/btad681/7420212
EMVC-2 employs a multi-class ensemble classification approach based on the expectation-maximization (EM) algorithm that infers at each locus the most likely genotype from multiple labels provided by different learners.
EMVC-2 uses a Decision Tree Classifier (DTC) to filter the untrue SNV candidates identified in the first step. A DTC is chosen as models based on DTs have been shown to discriminate well between true and false called variants in similar settings.


□ GexMolGen: Cross-modal Generation of Hit-like Molecules via Foundation Model Encoding of Gene Expression Signatures
>> https://www.biorxiv.org/content/10.1101/2023.11.11.566725v1
GexMolGen (Gene Expression-based Molecule Generator) based on a foundation model scGPT to generate hit-like molecules from gene expression differences. GexMolGen designs molecules that can induce the required transcriptome profile.
The molecules generated by GexMolGen exhibit a high similarity to known gene inhibitors. GexMolGen outperforms the cosine similarity method. This indicates that the model generates more molecular fragments and feature keys that are similar to the target molecules.

□ Methyl-TWAS: A powerful method for in silico transcriptome-wide association studies (TWAS) using long-range DNA methylation
>> https://www.biorxiv.org/content/10.1101/2023.11.10.566586v1
Methyl-TWAS predicts epigenetically regulated expression (eGReX), which incorporates genetically- (GReX), and environmentally-regulated expression, trait-altered expression, and tissue-specific expression to identify DEGs that could not be identified by genotype-based methods.
Methyl-TWAS incorporates both cis- and trans- CpGs, including enhancers, promoters, transcription factors, and miRNA regions to identify DEGs that would be missed using cis-DNA methylation-based methods.

□ GTExome: Modeling commonly expressed missense mutations in the human genome
>> https://www.biorxiv.org/content/10.1101/2023.11.14.567143v1
GTExome greatly simplifies the process of studying the three-dimensional structures of proteins containing missense mutations that are critical to understanding human health.
In contrast to current state-of-the-art methods, users with no external software or specialized training can rapidly produce three-dimensional structures of any possible mutation in nearly any protein in the human exome.

□ Nunchaku: Optimally partitioning data into piece-wise contiguous segments
>> https://academic.oup.com/bioinformatics/advance-article/doi/10.1093/bioinformatics/btad688/7421911
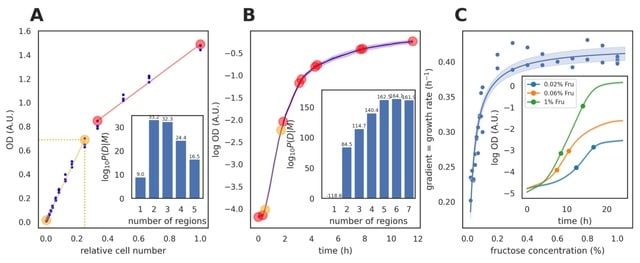
Nunchaku, a statistically rigorous, Bayesian approach to infer the optimal partitioning of a data set not only into contiguous piece-wise linear segments, but also into contiguous segments described by linear combinations of arbitrary basis functions.
Nunchaku provides a general solution to the problem of identifying discontinuous change points. The nunchaku algorithm to identifies the linear range, using basis functions that generate straight lines and an unknown measurement error.
Two linear segments are optimal, and the one of interest, where OD is proportional to the number of cells, is the segment beginning at the smallest OD. This segment also has the highest coefficient of determination R^2.

□ Benchmarking multi-omics integration algorithms across single-cell RNA and ATAC data
>> https://www.biorxiv.org/content/10.1101/2023.11.15.564963v1
Benchmarking 12 methods in the three categories: integration methods designed for paired datasets (scMVP, MOFA+): paired-guided integration category (MultiVI, Cobolt): for both paired and unpaired datasets (scDART, UnionCom, MMD-MA, scJoint, Harmony, Seurat v3, LIGER, and GLUE).
GLUE would be the best choice, followed by MultiVI. And these 2 methods are also the best choices for trajectory conservation. If one focuses on omics mixing, scART, LIGER, and Seurat are worth a try. As for cell type conservation, MOFA+, scMVP could be taken into consideration.

□ DeepLocRNA: An Interpretable Deep Learning Model for Predicting RNA Subcellular Localization with domain-specific transfer-learning
>> https://www.biorxiv.org/content/10.1101/2023.11.17.567519v1
DeepLocRNA, an RNA localization prediction tool based on fine-tuning of a multi-task RBP-binding prediction method, which was trained to predict the signal of a large cohort of eCLIP data at single nucleotide resolution.
DeepLocRNA can gain performance from the learned RBP binding information to downstream localization prediction, and robustly predicts the localization. Functional motifs can be extracted to do the model interpretation derived from the IG score across 4 nucleotide dimensions.

□ PQVD: Diffusion in a quantized vector space generates non-idealized protein structures and predicts conformational distributions
>> https://www.biorxiv.org/content/10.1101/2023.11.18.567666v1
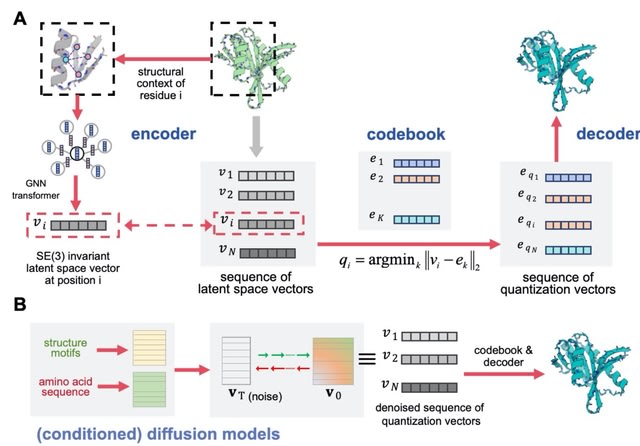
PVQD (protein vector quantization and diffusion) uses a graph-based Geometry Vector Perceptron (GVP) to encode and transform the structural context of a central residues surrounded by its 30 nearest neighbor residues. Each node of the graph corresponds to a residue.
PVQD models the joint distribution of the latent space vectors encoding backbone structures with a denoising diffusion probabilistic model (DDPM).
In DDPMs, a forward Markovian diffusion process of T time steps are used to gradually introducing Gaussian noise into the true data, while a network is trained to perform the inverse denoising process to recover the true data.
PVQD uses the denoising network architecture of Diffusion Transformers . The module was composed of 24 repeated Transformer blocks. The time step embedding is incorporated through the adaptive Layer Norm (AdaLN) modules.
Through denoising diffusion from Gaussian random noise, a sequence of the latent space vectors is generated by the diffusion module, which is subsequently mapped to a sequence of the quantized vectors, and decoded into a 3-dimensional backbone structure as in the auto-encoder.

□ CellSAM: A Foundation Model for Cell Segmentation
>> https://www.biorxiv.org/content/10.1101/2023.11.17.567630v1
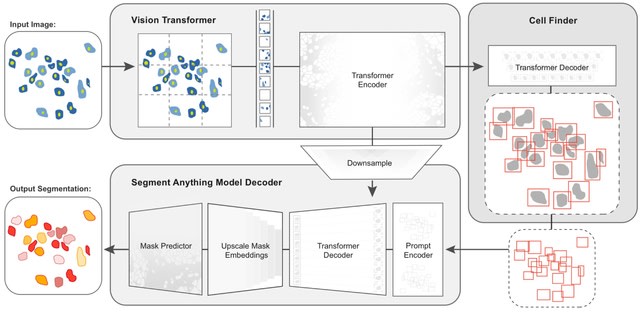
CellSAM, a foundation model for cell segmentation that generalizes across diverse cellular imaging data. CellSAM builds on top of the Segment Anything Model (SAM) by developing a prompt engineering approach to mask generation.
CellFinder, a transformer-based object detector that uses the Anchor DETR framework. It automatically detects cells and prompt SAM to generate segmentations.

□ regioneReloaded: evaluating the association of multiple genomic region sets
>> https://academic.oup.com/bioinformatics/advance-article/doi/10.1093/bioinformatics/btad704/7439591
RegioneReloaded is a package that allows simultaneous analysis of associations between genomic region sets, enabling clustering of data and the creation of ready-to-publish graphs.
RegioneReloaded takes over and expands on all the features of its predecessor regioneR. It also incorporates a strategy to improve p-value calculations and normalize z-scores coming from multiple analysis to allow for their direct comparison.

□ MAJIQ-L: Contrasting and Combining Transcriptome Complexity Captured by Short and Long RNA Sequencing Reads
>> https://www.biorxiv.org/content/10.1101/2023.11.21.568046v1
MAJIQ-L, an extension of the MAJIQ to enable a unified view of transcriptome variations from both technologies and demonstrate its benefits. It can be used to assess any future long reads algorithm, and combine w/ short reads data for improved transcriptome analysis.
MAJIQ-L constructs unified gene splice graphs with all isoforms and all LSVs visible for analysis. This unified view is implemented in a new visualization package (VOILA v3), allowing users to inspect each gene of interest where the three sources agree or differ.

□ Improved quality metrics for association and reproducibility in chromatin accessibility data using mutual information
>> https://bmcbioinformatics.biomedcentral.com/articles/10.1186/s12859-023-05553-0
A random subsampling strategy to generate synthetic replicates with varying portions of shared peaks, as a proxy for reproducibility. Across this simulations, we apply the Pearson's R and Spearman's p and monitor their behavior, including the effect of removing co-zeros.
Removing co-zero values had a similar effect on association metrics, attenuating and improving the average AUC across the portion of shared peaks between synthetic replicates.

□ AOPWIKI-EXPLORER: An Interactive Graph-based Query Engine leveraging Large Language Models
>> https://www.biorxiv.org/content/10.1101/2023.11.21.568076v1
Unveiling the capacity of a Labeled Property Graph (LPG) data modelling paradigm to serve as a natural data structure for Adverse Outcome Pathways (AOP). In LPG, data is organized into nodes and relationships in contrast with RDF-triples which consist of subject-predicate-object.
AOPWIKI-EXPLORER provides a unified full-stack solution of graph data implementation that encompasses essential components i.e., data structure, query generator, and interactive interpretation. It harmoniously converges to create an invaluable toolset.

□ Design of Worst-Case-Optimal Spaced Seeds
>> https://www.biorxiv.org/content/10.1101/2023.11.20.567826v1
For any mask, using integer linear programs. (1) minimizing the number of unchanged windows; (2) minimizing the number of positions covered by unchanged windows. Then, among all masks of a given shape (k, w), the set of best masks that maximize these minima.
The optimal mask(s) unsurprisingly depend on the model parameters, but at least for simple Bernoulli models, where a change can appear at each sequence position independently with some small probability p, the problem has been comprehensively solved:
The probability of at least one hit can computed as parameterized polynomial in p, from which one can identify the small set of masks that are optimal for some value of p, or integrated over a certain p-interval.
In essence, one uses dynamic programming to count (or accumulate probabilities of binary sequences) that do not contain the mask as a substring; these calculations can be carried out symbolically.

□ PyCoGAPS: Inferring cellular and molecular processes in single-cell data with non-negative matrix factorization using Python, R and GenePattern Notebook implementations of CoGAPS
>> https://www.nature.com/articles/s41596-023-00892-x
A generalized discussion of NMF covering its benefits, limitations, and open questions in the field is followed by three vignettes for the Bayesian NMF algorithm CoGAPS (Coordinated Gene Activity across Pattern Subsets).
PyCoGAPS, a new Python interface for CoGAPS to enhance accessibility of this method. Their three protocols then demonstrate step-by-step NMF analysis across distinct software platforms.

□ A genome-wide segmentation approach for the detection of selection footprints
>> https://www.biorxiv.org/content/10.1101/2023.11.22.568282v1
Reformulating the problem of detecting regions with abnormally high Fst levels as a multiple changepoint detection or segmentation problem. The procedure relies on statistically grounded and computationally efficient approaches for multiple changepoint detection.
The time complexity of the FPOP algorithm is on average Onlog(n)). Its space complexity is O(n). Therefore, not storing the 2 matrices while running the pDPA and using FPOP to recover the segmentation in D segments yields an average 0(Dmaxn log(n)) time and O(n) space complexity.

□ MiREx: mRNA levels prediction from gene sequence and miRNA target knowledge
>> https://bmcbioinformatics.biomedcentral.com/articles/10.1186/s12859-023-05560-1
miREx, a Convolutional Neural Network (CNN) model for predicting mRNA expression levels from gene sequence and miRNA post-transcriptional information. miREx’s architecture is inspired by Xpresso, a SOTA model for mRNA level prediction that exploits DNA sequence and gene features.
MiREx exploits the Xpresso CNN architecture as a backbone. It consists of convolutional and max-pooling layers applied on the one-hot encoded DNA sequence. miRNA expression levels are also concatenated to the DNA sequence and half-life features.

□ MLN-O: analysis of multiple phenotypes for extremely unbalanced case-control association studies using multi-layer network
>> https://academic.oup.com/bioinformatics/advance-article/doi/10.1093/bioinformatics/btad707/7441501
MLN-O (Multi-Layer Network with Omnibus) uses the score test to test the association of each merged phenotype in a cluster and a SNP and then uses the Omnibus test to obtain an overall test statistic to test the association between all phenotypes and a SNP.
MLN-O is designed for dimension reduction of correlated and extremely unbalanced case-control phenotypes.
MLN enhances the connectivity of phenotypes. It only considers individuals with at least one case status but does not consider individuals without any diseases. Because they do not carry any information to reveal the clustering structures among phenotypes.

□ Efficient construction of Markov state models for stochastic gene regulatory networks by domain decomposition
>> https://www.biorxiv.org/content/10.1101/2023.11.21.568127v1
Decomposing the state space via a Voronoi tessellation and estimate transition probabilities by using adaptive sampling strategies. They apply the robust Perron cluster analysis (PCCA+) to construct the final Markov State Models.
They provide a proof-of-concept by applying the approach to two different networks of mutually inhibiting gene pairs with different mechanisms of self-activation. These are frequently occurring motifs in transcriptional regulatory networks to control cell fate decisions.

□ ChromaX: a fast and scalable breeding program simulator
>> https://academic.oup.com/bioinformatics/advance-article-abstract/doi/10.1093/bioinformatics/btad691/7441500
ChromaX is based on the high-performance numerical computing library JAX. Using JAX, ChromaX functions are compiled in XLA (Accelerated Linear Algebra), a compiler for linear algebra that accelerates function execution according to the domain and hardware available.
ChromaX simulates the genetic recombinations that take place during meiosis to create new haplotypes. ChromaX computes the genomic value by performing a tensor contraction of the marker effect with the input population array of markers.

□ Taxometer: Improving taxonomic classification of metagenomics contigs
>> https://www.biorxiv.org/content/10.1101/2023.11.23.568413v1
Taxometer, a neural network based method that improves the annotations and estimates the quality of any taxonomic classifier by combining contig abundance profiles and tetra-nucleotide frequencies.
Taxometer improves taxonomic annotations of any contig-level metagenomic classifier. Taxometer both filled annotation gaps and deleted incorrect labels. Additionally, Taxometer provides a metric for evaluating the quality of annotations in the absence of ground truth.

□ Charm is a flexible pipeline to simulate chromosomal rearrangements on Hi-C-like data.
>> https://www.biorxiv.org/content/10.1101/2023.11.22.568374v1
Charm, a novel simulator for Hi-C maps, also referred to as Chromosome rearrangement modeler. Charm captures different aspects of the Hi-C data structure, encompassing aspects like coverage bias and compartment patterns.
Charm employs Hi-C maps simulating different SV types to benchmark EagleC deep-learning framework. EagleC predicts SV breakpoint as a pair of genomic coordinates and provides four probability scores for each SV depending on the genomic orientation of rearranged loci.


※コメント投稿者のブログIDはブログ作成者のみに通知されます