lens, align.

Lang ist Die Zeit, es ereignet sich aber Das Wahre.

Paragate.

2022-10-17 22:17:37 | Science News


□ scLTNN: Identify the origin and end cells and infer the trajectory of cellular fate automatically

>> https://www.biorxiv.org/content/10.1101/2022.09.28.510020v1

scLTNN (single cell latent time neuron network) identifies origin and end cell states from scRNA-seq data by combining a priori latent time predictions using scVelo, and genes whose expression patterns correlate with gene counts.

scLTNN uses the raw matrix to calculate the origin and end cells by ANN-time prediction and automatically selects the origin cells as the root of the PAGA graph. The scLTNN then constructed a RANN regression model to predict the intermediate moments using the LSI vectors.


□ Minigraph-Cactus: Pangenome Graph Construction from Genome Alignment

>> https://www.biorxiv.org/content/10.1101/2022.10.06.511217v1

Minigraph-Cactus combines Minigraph’s fast assembly-to-graph mapping with Cactus’s base aligner in order to produce base-level pangenome graphs at the scale of hundreds of vertebrate haplotypes.

Minigraph-Cactus combines the chromosome level results. Nodes are replaced with their reverse complement to ensure that reference paths only ever visit them. The original SV graph remains at this stage, with each minigraph node being represented by a separate embedded path.


□ SPRUCE: Single-cell Pairwise Relationships Untangled by Composite Embedding model

>> https://www.biorxiv.org/content/10.1101/2022.09.16.508327v1

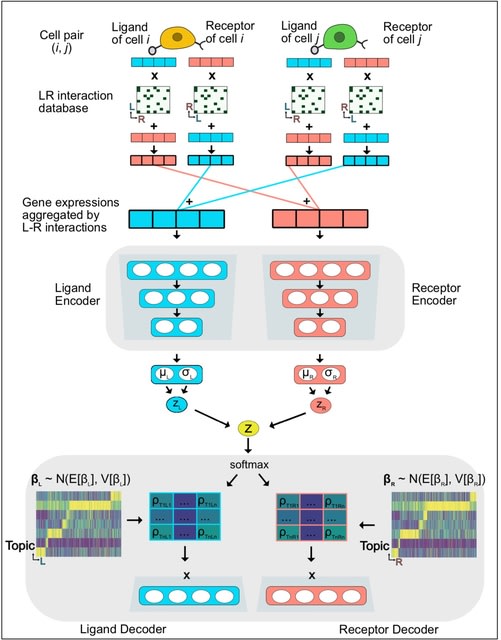
SPRUCE, Single-cell Pairwise Relationship Untangled by Composite Embedding, to analyze tens of millions of cell pairs in a scalable way. Adopting known ligand and receptor protein-protein interactions.

SPRUCE is based on an Embedded Topic Model, and represents single-cell vector data in low-dimension topic space with an interpretable topic-specific GE dictionary matrix. The SPRUCE model considers cell-cell interaction patterns as a stream of edges, or a giant incidence matrix.


□ scSemiGAN: a single-cell semi-supervised annotation and dimensionality reduction framework based on generative adversarial network

>> https://academic.oup.com/bioinformatics/advance-article-abstract/doi/10.1093/bioinformatics/btac652/6747954

scSemiGAN, a semi-supervised cell-type annotation and dimensionality reduction framework based on generative adversarial network, modeling scRNA-seq data from the aspect of data generation.

scSemiGAN is capable of performing deep latent representation learning and cell-type label prediction simultaneously. Guided by a few known cell-type labels, dimensionality reduction and cell-type annotation are jointly optimized.


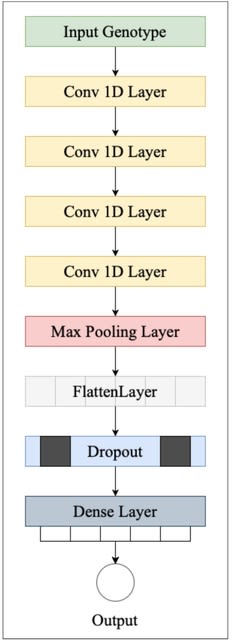
□ xAI: Obtaining genetics insights from deep learning via explainable artificial intelligence

>> https://www.nature.com/articles/s41576-022-00532-2

The model parameters are sensitive to random selection of training examples and the initialization parameters. Model-based interpretations are most sensitive to this un-identifiability issue; however, This phenomenon affects all interpretation techniques to varying degrees.

xAI algorithms can examine the inner workings of black box such as DNNs to reveal the basis on which predictions are made. A transparent neural network model is one in which the hidden nodes are constructed to physically correspond to biological units at a level of granularity.


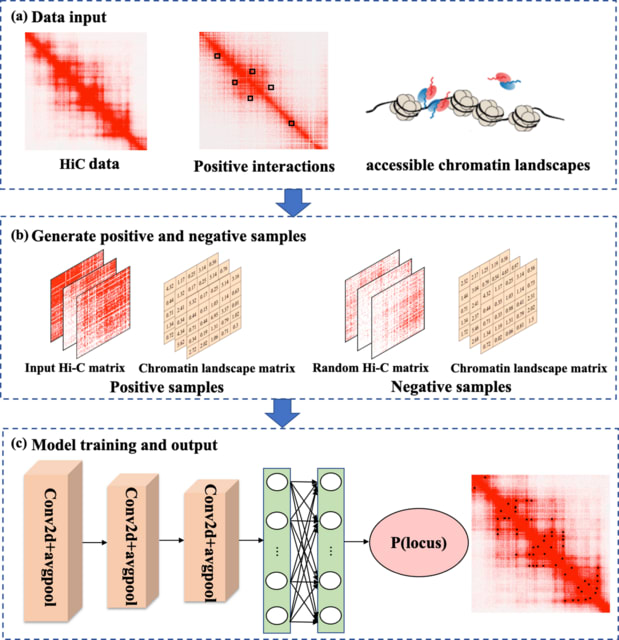
□ Deciphering multi-way interactions in the human genome

>> https://www.nature.com/articles/s41467-022-32980-z

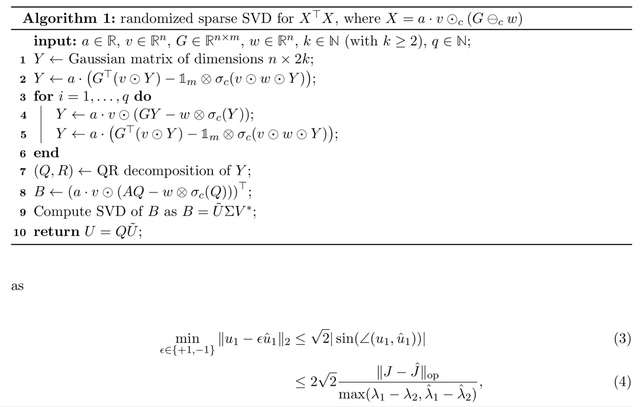
Using incidence matrix-based representation and analysis of multi-way chromatin structure directly captured by Pore-C data (Algorithm 1), which is mathematically simple and computationally efficient, and yet can provide insights into genome architecture.

In this hypergraph framework, nodes are genomic loci and hyperedges are multi-way contacts among loci. Rows are genomic loci and columns are individual hyperedges. This representation enabled quantitative measurements of chromatin architecture through hypergraph entropy.


□ EagleImp: Fast and Accurate Genome-wide Phasing and Imputation in a Single Tool

>> https://academic.oup.com/bioinformatics/advance-article/doi/10.1093/bioinformatics/btac637/6706779

EagleImp combines the core methods from Eagle2 and PBWT, since both tools are used by the established SIS web service and both use the same-named Position- based Burrows-Wheeler Transform (PBWT) data structure.

Its main advantages are the compact representation of binary data and the ability to quickly look up any binary sequence at any position in the data.

To create a PBWT, the algorithm determines permutations of the input sequences for each genomic site such that the subsequences ending at that site are sorted when read backwards.


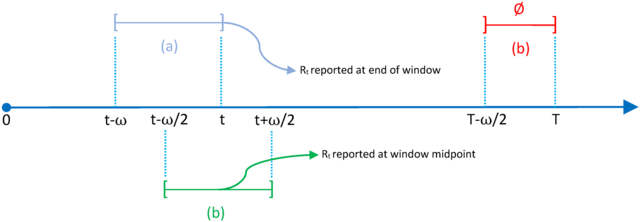
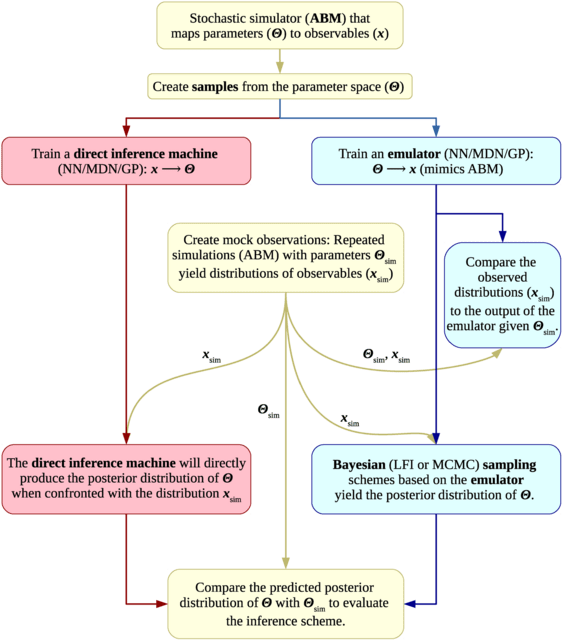
□ EpiLPS: A fast and flexible Bayesian tool for estimation of the time-varying reproduction number

>> https://journals.plos.org/ploscompbiol/article?id=10.1371/journal.pcbi.1010618

The proposed Bayesian methodology is based on a latent Gaussian model for the B-spline amplitudes and opens up two possible paths for inference. LPSMAP, a fully sampling-free approach based on Laplace approximations to the conditional posterior of B-spline coefficients.

The Laplacian-P-splines with a Metropolis-adjusted Langevin algorithm uses Langevin dynamics for efficient sampling of the target posterior distribution and is a MCMC approach based on the Langevin diffusion for exploration of the posterior distribution of latent variables.


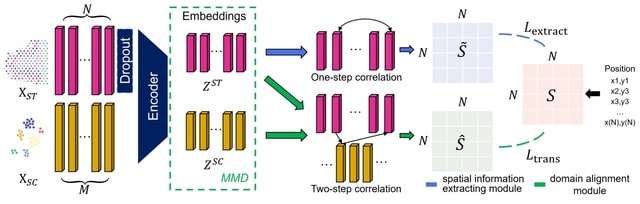
□ STEM: Learning Spatially-Aware Representations of Transcriptomic Data via Transfer Learning

>> https://www.biorxiv.org/content/10.1101/2022.09.23.509186v1

The STEM encoder represents SC and ST gene expression vectors as embeddings in a unified latent space. The embeddings are simultaneously optimized by two modules of predictor: the spatial information extracting module and the domain alignment module.

STEM identifies spatially dominant genes (SDGs) that highly dominate the inferred spatial location of a cell, which could benefit the understanding of underlying mechanisms related to cellular spatial organization or communication.

The domain alignment module uses SC and ST embeddings and eliminates the SC-ST domain gap by first minimizing the Maximum Mean Discrepancy (MMD) of SC and ST embeddings and then constructing ST-SC-ST spatial associations as ST adjacency to find the optimal mapping matrix.


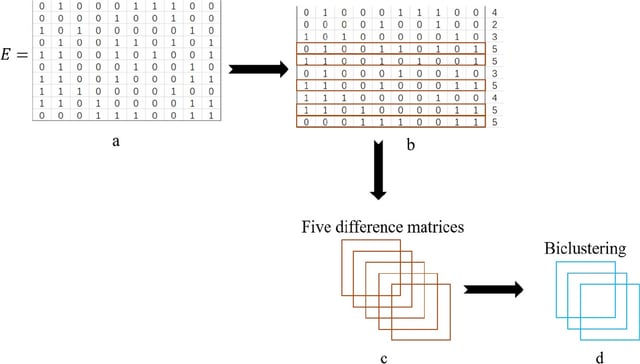
□ AMBB: A binary biclustering algorithm based on the adjacency difference matrix for gene expression data analysis

>> https://bmcbioinformatics.biomedcentral.com/articles/10.1186/s12859-022-04842-4

AMBB, the Adjacency Difference Matrix Binary Biclustering algorithm constructs the adjacency matrix based on the adjacency difference values, and the submatrix obtained by continuously updating the adjacency difference matrix is called a bicluster.

The adjacency matrix allows for clustering of gene that undergo similar reactions under different conditions into clusters, which is important for subsequent genes analysis. The AMBB algorithm outperforms BiBit, QUBIC and Bimax algorithms in the synthetic dataset.

The AMBB algorithm uses the row with the highest number of 1’s in the binary matrix as the seed, and iterates the row and column elements continuously. The AMBB algorithm does not require to encode and traverse all rows for continuous seed acquisition.


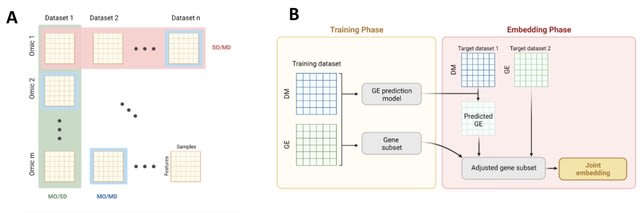
□ INTEND: Integration of Gene Expression and DNA Methylation Data Across Different Experiments

>> https://www.biorxiv.org/content/10.1101/2022.09.21.508920v1

INTEND (IntegratioN of Transcriptomic and EpigeNomic Data) learns a function that predicts its expression based on the methylation levels in sites located proximal to it. INTEND first predicts for each methylation profile its expression profile.

INTEND identifies a set of genes that will be used for the joint embedding of the expression and predicted expression datasets. At this stage, both datasets share the same feature space. INTEND then employs canonical-correlation analysis (CCA) to jointly reduce their dimension.


□ Astar Pairwise Aligner: Exact global alignment using A* with seed heuristic and match pruning

>> https://www.biorxiv.org/content/10.1101/2022.09.19.508631v1

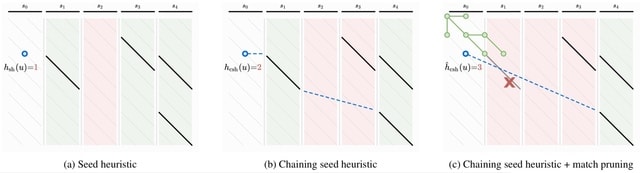
Solving exact global pairwise alignment with respect to edit distance by using the A⋆ shortest path algorithm on the edit graph. And extending the seed heuristic for A⋆ with match chaining, inexact matches, and the novel match pruning optimization.

For random sequences with up to 15% uniform errors, the runtime of A*PA scales near-linearly to very long sequences (107 bp) and outperforms other exact aligners.

Since it is unlikely that edit distance in general can be solved in strongly subquadratic time, it is inevitable that there are inputs for which the algorithm requires quadratic time. Regions with high error rate, long indels, and too many matches trigger quadratic exploration.


□ SOPHIE: Generative Neural Networks Separate Common and Specific Transcriptional Responses

>> https://www.sciencedirect.com/science/article/pii/S1672022922001279

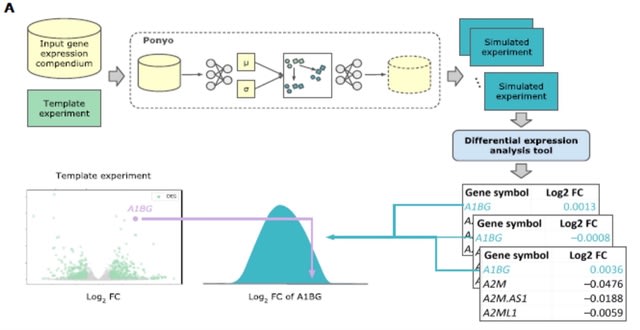
Specific cOntext Pattern Highlighting In Expression data (SOPHIE), for distinguishing common / specific transcriptional patterns using a generative neural network to create a background set of experiments from which a null distribution of gene / pathway changes can be generated.

SOPHIE returned consistent genes and pathways, by percentile. SOPHIE’s specificity score can be a complementary indicator of activity compared to the traditional log fold change measure and can help drive future analyses.


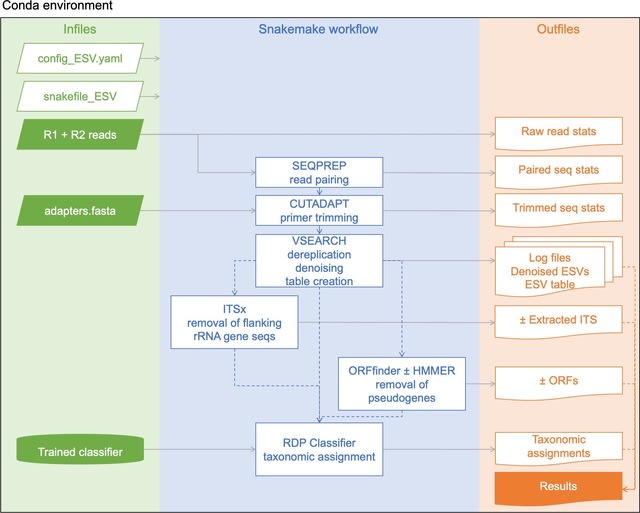
□ aMeta: an accurate and memory-efficient ancient Metagenomic profiling workflow

>> https://www.biorxiv.org/content/10.1101/2022.10.03.510579v1

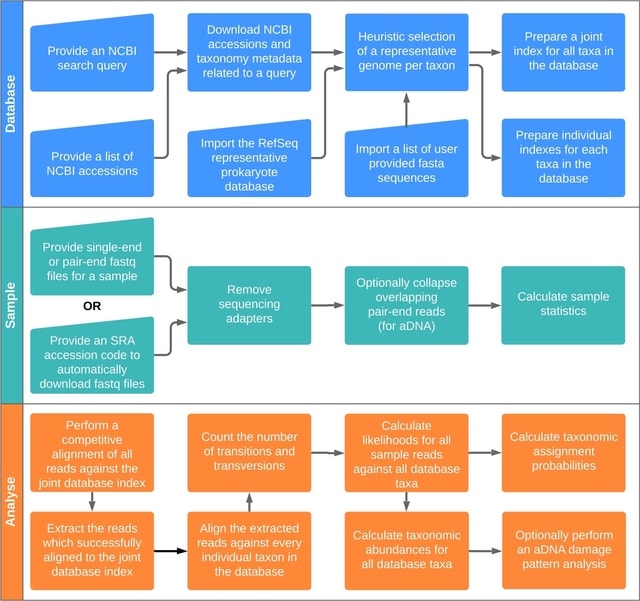
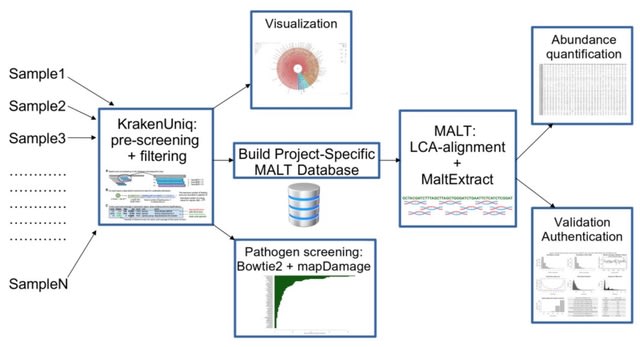
aMeta combines the strengths of both classification- and alignment-based approaches with low detection and authentication errors. aMeta uses KrakenUniq for initial taxonomic profiling of metagenomic samples and informing MALT reference database construction.

aMeta performs an alignment with the Lowest Common Ancestor (LCA) algorithm implemented in MALT. aMeta minimizes potential conflicts between classification (KrakenUniq) and alignment (MALT) approaches by ensuring consistent use of the reference database.


□ SCAFE: a software suite for analysis of transcribed cis-regulatory elements in single cells

>> https://academic.oup.com/bioinformatics/advance-article/doi/10.1093/bioinformatics/btac644/6730725

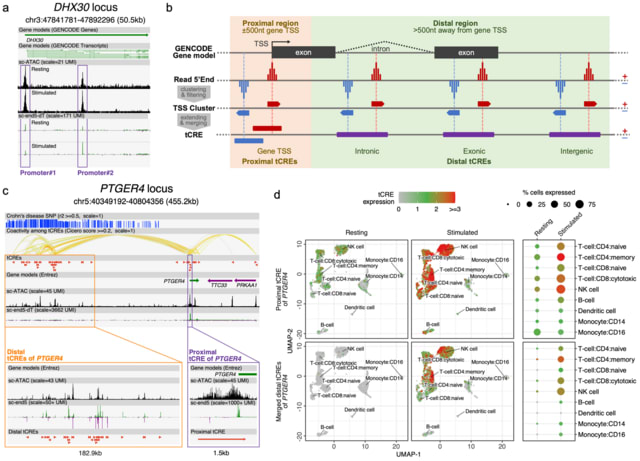
SCAFE (Single Cell Analysis of Five-prime Ends), a software suite that processes sc- end5-seq data to de novo identify TSS clusters based on multiple logistic regression. It annotates tCREs based on the identified TSS clusters and generates a tCRE-by-cell count matrix.

SCAFE defines tCREs by merging closely located TSS clusters and annotates these tCREs as proximal or distal based on their distance. It defines hyperactive distal loci by stitching closely located distal tCREs with disproportionately high activities, analogous to super-enhancers.


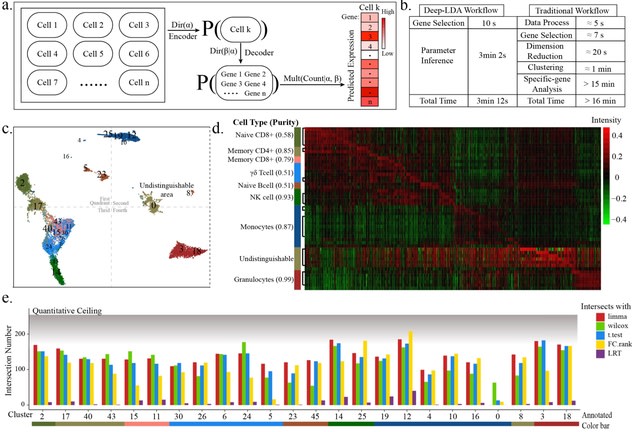
□ Optimization and redevelopment of single-cell data analysis workflow based on deep generative models

>> https://www.biorxiv.org/content/10.1101/2022.09.12.507562v1

Deep-LDA (a latent Dirichlet allocation-based deep generative model) model was applied on the 3-phase data, whose clustering results had a high consistency with the real distribution at all phases.

The distribution shape drawn from this model was more similar with the real distribution shape, and did not form a blocky distribution like other clustering procedures, which suggested Deep-LDA has a higher nonlinear fitting ability.

The outcome of the model was not optimized according to the uniform dimensionality reduction space which was the space for internal clustering metrics calculation, but was optimized according to the inferred feature space of different classes.

The generative architecture of Deep-LDA in this project was the classical LDA architecture of topic modeling and was not re-designed according to the characteristic of scRNA-seq data, such as incorporating the parameter for controlling the 0-inflation ratio.


□ Dictys: dynamic gene regulatory network dissects developmental continuum with single-cell multi-omics

>> https://www.biorxiv.org/content/10.1101/2022.09.14.508036v1

Dictys model single-cell transcriptional kinetics to allow for feedback loops, using the Ornstein-Uhlenbeck (OU) process with empirical contributions from basal transcription, direct GRN by TF binding, and stochasticity.

Dictys steady-state distribution then characterizes the biological variations in single-cell expression. Conversely, single-cell technical variation/noise is modeled with sparse binomial sampling. Dictys includes a suite of functions to understand and compare context specific networks.


□ RNAlight: a machine learning model to identify nucleotide features determining RNA subcellular localization

>> https://www.biorxiv.org/content/10.1101/2022.09.16.508211v1

RNAlight identifies nucleotide k-mers contributing to the subcellular localizations of mRNAs and lncRNAs. With embedded Tree SHAP algorithm, RNAlight further reveals distinct key sequence features and their associated RBPs for subcellular localizations.

By assembling k-mers to sequence features and subsequently mapping to known RBP-associated motifs, different types of sequence features and their associated RBPs were additionally uncovered for lncRNAs and mRNAs with distinct subcellular localizations.


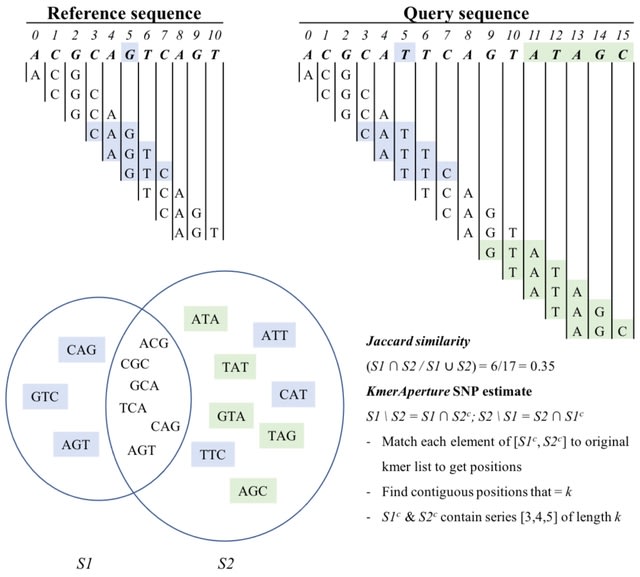
□ TandemAligner: a new parameter-free framework for fast sequence alignment

>> https://www.biorxiv.org/content/10.1101/2022.09.15.507041v1

Counterintuitively, the classical alignment approaches, such as the Smith-Waterman algorithm, that work well for most sequences, fail to construct biologically adequate alignments of the extra-long tandem repeats (ETRs).

TandemAligner — the parameter-free sequence alignment algorithm that introduces a sequence-dependent alignment scoring that automatically changes for any pair of compared sequences. TandemAligner illustrates its performance using human centromeres and primate immunoglobulin loci.


□ FrameRate: learning the coding potential of unassembled metagenomic reads

>> https://www.biorxiv.org/content/10.1101/2022.09.16.508314v1

The FrameRate model can predict the coding frame(s) from unassembled DNA sequencing reads directly, thus greatly reducing the computational resources required for genome assembly and similarity-based inference to pre-computed databases.

FrameRate captured equivalent functional profiles from the coding frames while reducing the required storage and time resources significantly. FrameRate was also able to annotate reads that were not represented in the assembly, capturing this ’missing’ information.


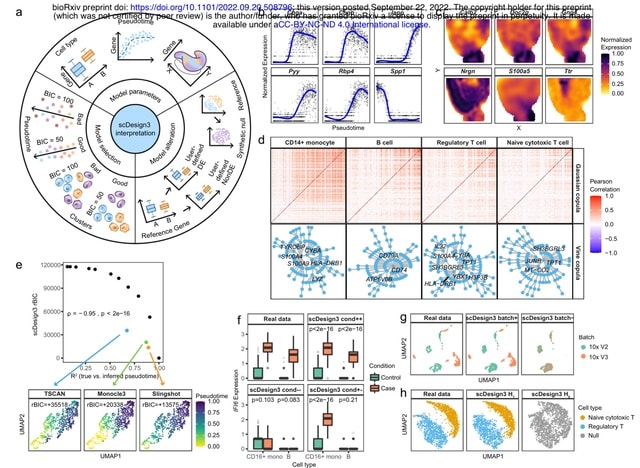
□ scDesgin3: A unified framework of realistic in silico data generation and statistical model inference for single-cell and spatial omics

>> https://www.biorxiv.org/content/10.1101/2022.09.20.508796v1

scDesign3 is beyond a versatile simulator and has unique advantages for generating customized in silico data, which can serve as negative and positive controls for computational analysis, and for assessing the quality of cell clusters and trajectories with statistical rigor.

scDesign3 resembles two single-cell chro- matin accessibility datasets profiled by the sci-ATAC-seq and 10x scATAC-seq protocols. scDesign3 mimics a CITE-seq dataset and simulates a multi-omics dataset from separately measured RNA expression and DNA methylation modalities.


□ Totem: a user-friendly tool for clustering-based inference of tree-shaped trajectories from single-cell data

>> https://www.biorxiv.org/content/10.1101/2022.09.19.508535v1

Totem generates a large number of clustering results, estimates their topologies as minimum spanning trees (MST), and uses them to measure the connectivity of the cells.

Totem uses a k-medoids algorithm. Totem is built upon the Slingshot method, which uses a clustering to construct an MST and the simultaneous principal curves algorithm to obtain a directed trajectory along w/ pseudotime that quantifies cell differentiation at the sc-level.


□ cell2sentence: Representing cells as sentences enables natural-language processing for single-cell transcriptomics

>> https://www.biorxiv.org/content/10.1101/2022.09.18.508438v1

cell2sentence, a novel method for the transformation of expression matrices to abundance-ordered lists, where genes are analogous to words, and cells are analogous to sentences. It can be directly rendered as space-delimited text, in a manner similar to natural language.

This adapted approach incorporates prior knowledge of gene homologs by using fused Gromov-Wasserstein optimal transport, which smoothly interpolates between pure Wasserstein / pure Gromov optimal transport, with cost weighting subject to a hyperparameter.


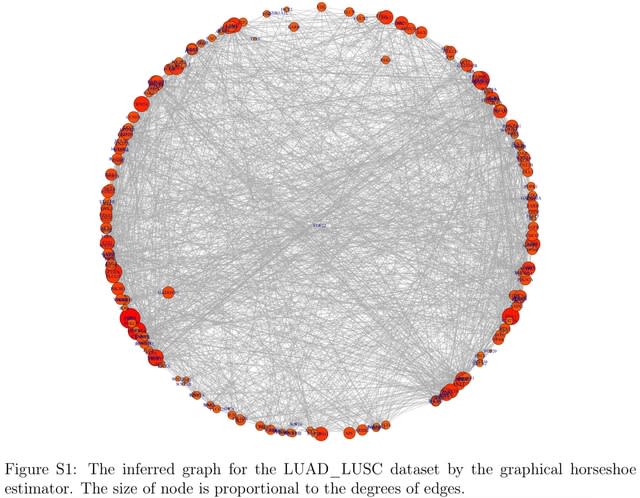
□ The GR2D2 estimator for the precision matrices

>> https://academic.oup.com/bib/advance-article-abstract/doi/10.1093/bib/bbac426/6731716

GR2D2 (Graphical R^2-induced Dirichlet Decomposition), a new Gaussian Graphical Model based on the R2D2 priors for linear models. Posterior samples under the GR2D2 hierarchical model are drawn by an augmented block Gibbs sampler algorithm.

The GR2D2 model puts R2D2 priors on the off-diagonal elements of the precision matrix. When the true precision matrix is sparse and of high dimension, the GR2D2 provides the estimates with smallest information divergence from the underlying truth.

In high-dimensional precision matrix estimation, the global shrinkage parameter adapts to the sparsity of the entire matrix and shrinks the estimates of the off-diagonal elements toward zero. The local shrinkage parameters preserve the magnitude of nonzero off-diagonal elements.


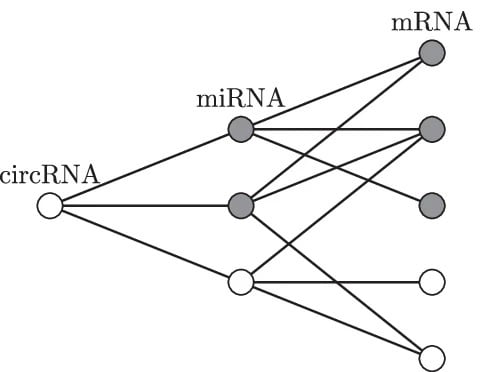
□ circGPA: circRNA functional annotation based on probability-generating functions

>> https://bmcbioinformatics.biomedcentral.com/articles/10.1186/s12859-022-04957-8

circGPA (circRNA generating-polynomial annotator), an efficient and exact procedure that is based on the principle of probability-generating functions. circGPA calculates all the p-values exactly.

A statistic that quantifies the size of the neighborhood of the circRNA that is annotated with a term of certain cardinality is introduced. The probability mass function of the statistic, which is a discrete random variable, is represented as a power series.


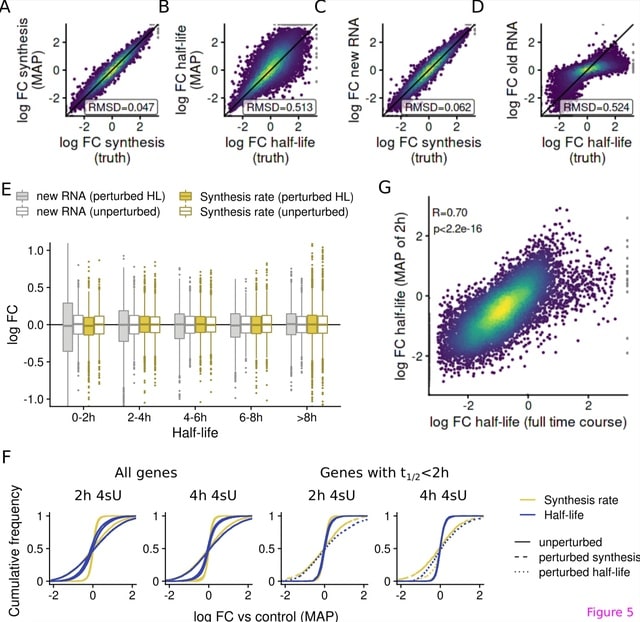
□ grandR: a comprehensive package for nucleotide conversion sequencing data analysis

>> https://www.biorxiv.org/content/10.1101/2022.09.12.507665v1

grandR facilitates analyses of nucleotide conversion sequencing experiments. It includes new methods for quality control and recalibrating labeling times.

grandR is designed as a comprehensive and easy-to-use toolkit for all types of nucleotide conversion sequencing data such as SLAM-seq, Timelapse-seq or TUC-seq.

The most accurate results are obtained by directly utilizing the posteriors from GRAND-SLAM to estimate the kinetic model. A Bayesian hierarchical model dissects the mode of gene regulation from snapshot experiments.


□ ortho_seqs: A Python tool for sequence analysis and higher order sequence-phenotype mapping

>> https://www.biorxiv.org/content/10.1101/2022.09.14.506443v1

ortho_seqs quantifies higher order sequence-phenotype interactions based on our previously published method of applying multivariate tensor-based orthogonal polynomials to biological sequences.

Using ortho_seqs, nucleotide or amino acid sequence information is converted to a 4-dimensional vector, which are then used to build and compute the first- and higher order tensor-based orthogonal polynomials.


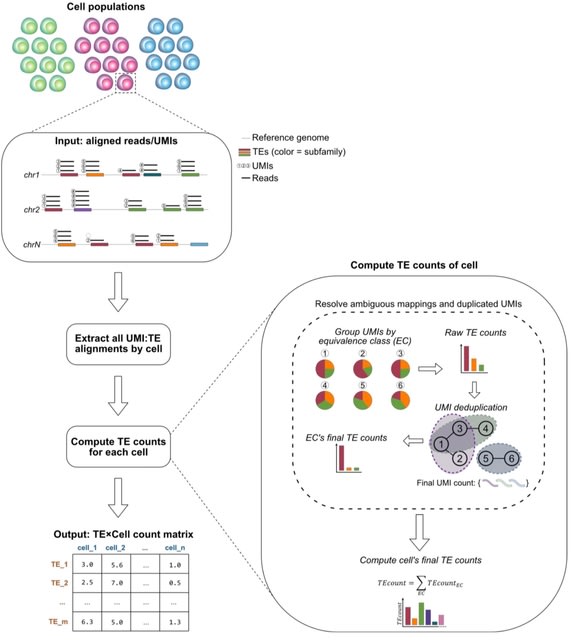
□ IRescue: single cell uncertainty-aware quantification of transposable elements expression

>> https://www.biorxiv.org/content/10.1101/2022.09.16.508229v1

IRescue (Interspersed Repeats single-cell quantifier), a software to quantify TE expression in scRNA-seq using a UMI-TE equivalence class-based algorithm to solve the allocation of reads ambiguously mapped on interspersed TEs.

IRescue is currently the only software that, in case of UMIs mapping multiple times on different TE subfamilies, takes into account all mapped features to estimate the correct one, rather than excluding multi-mapping UMIs or picking one randomly.


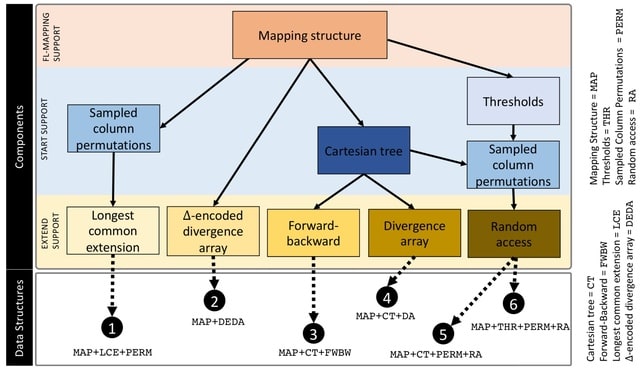
□ Compressed Data Structures for Population-Scale Positional Burrows–Wheeler Transforms

>> https://www.biorxiv.org/content/10.1101/2022.09.16.508250v1

The time complexity of finding maximal haplotype matches using the PBWT is a significant improvement over the naïve pattern-matching algorithm that requires O(h2w)-time.

A comprehensive study of the memory footprint of data structures supporting maximal haplotype matching in conjunction with the PBWT. The study contributes formal definition of finding set-maximal exact match (SMEMs) in the PBWT, and the queries needed to support finding SMEMs.


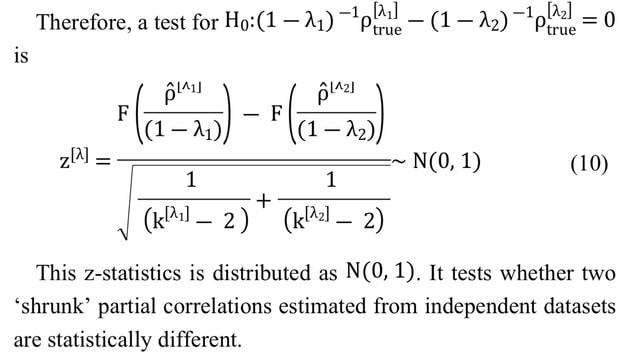
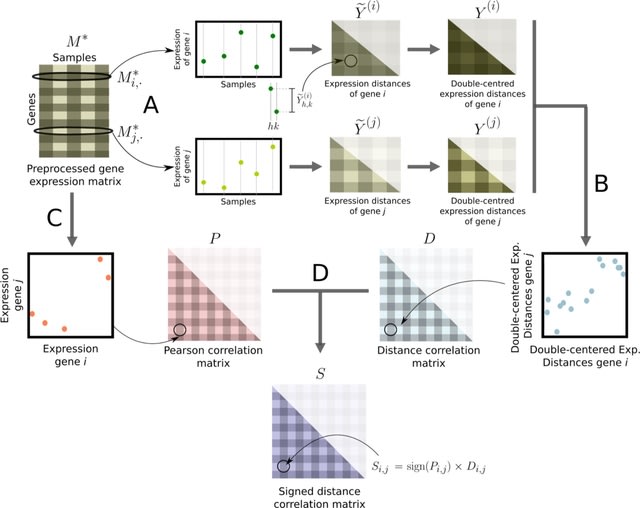
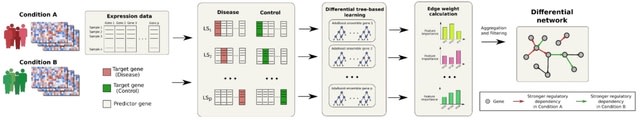
□ GeneNetTools: Tests for Gaussian graphical models with shrinkage

>> https://academic.oup.com/bioinformatics/advance-article/doi/10.1093/bioinformatics/btac657/6731926

While the covariance matrix can always be estimated from data, in this case the estimated matrix must be invertible and well-conditioned. This requirement ensures that the inverse of the covariance matrix exists and that its computation is stable.

Deriving the statistical properties of the partial correlation obtained with the Ledoit-Wolf shrinkage. The result provides a toolbox for (differential) network analyses as i) confidence intervals, ii) a test for zero partial correlation (null-effects), and iii) a test to compare partial correlations.


□ SPV: Structural position vectors and symmetries in complex networks

>> https://aip.scitation.org/doi/10.1063/5.0107583

Symmetric nodes can be used to develop coarse-grained simulations, identify the evolution law of the network, and determine the network’s synchronization dynamics.

SPV can identify symmetric nodes in linear time and dramatically speed up calculations. Nodes having equal SPV values is a strong necessary condition for them being symmetric to each other.


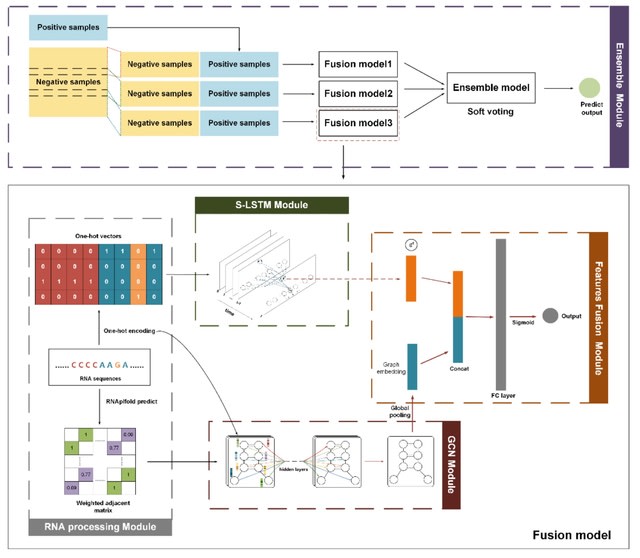
□ DeepCIP: a multimodal deep learning method for the prediction of internal ribosome entry sites of circRNAs

>> https://www.biorxiv.org/content/10.1101/2022.10.03.510726v1

DeepCIP is the first predictor for circRNA IRESs, which consists of an RNA processing module, an S-LSTM module, a GCN module, a feature fusion module, and an ensemble module. S-LSTM can represent circRNA IRES sequences more efficiently.

S-LSTM learns the representation of sequence by the Graph LSTM method. The performance of the sequence model is affected by many hyperparameters such as the number of sentence-level nodes, the window size, the time step, and the hidden layer size in the S-LSTM module.
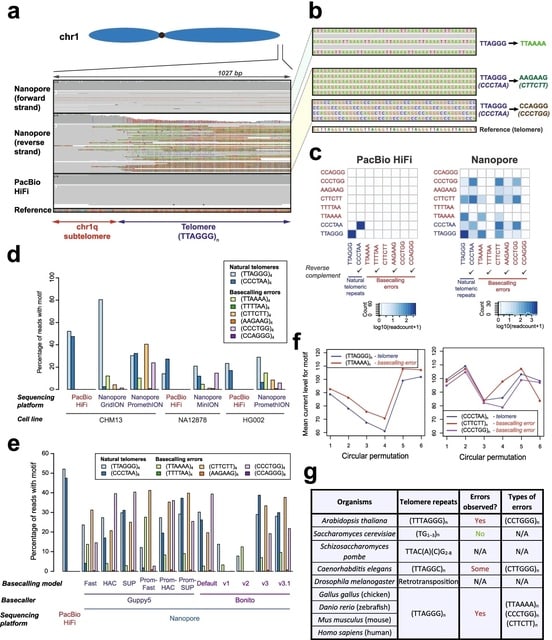


□ GATK Dev Team

>> https://github.com/broadinstitute/gatk/releases/tag/4.3.0.0

GATK 4.3.0.0 adds stable support for the UltimaGenomics flow-based sequencing platform among other feature improvements.


□ Genetics of human telomere biology disorders

>> https://www.nature.com/articles/s41576-022-00527-z

#Review by Patrick Revy, Caroline Kannengiesser & @ABertuch
@Inserm @InstitutImagine @APHP @bcmhouston


Gnosis.

2022-10-17 22:13:36 | Science News


□ KAGE: fast alignment-free graph-based genotyping of SNPs and short indels

>> https://genomebiology.biomedcentral.com/articles/10.1186/s13059-022-02771-2

KAGE – a new genotyper for SNPs and short indels that builds on recent ideas of alignment-free genotyping from Malva and PanGenie for computationally efficiency. KAGE is able to genotype a full sample with 15x coverage in only about 12 minutes using 16 compute cores.

KAGE and PanGenie, which are completely alignment-free, are able to achieve very close accuracy to Graphtyper, which first maps and aligns all reads using BWA-MEM and then locally realigns all reads to a sequence graph.

KAGE genotypes a bi-allelic variant. The different possible genotypes are calculated using combinations of Poisson models. KAGE uses a graph-representation of all variants, and considers all possible ways to pick kmers around the two alleles of a variant.


□ hdWGCNA: High dimensional co-expression networks enable discovery of transcriptomic drivers in complex biological systems

>> https://www.biorxiv.org/content/10.1101/2022.09.22.509094v1

hdWGCNA is capable of performing isoform-level network analysis using long-read single-cell data. hdWGCNA is directly compatible with Seurat, and demonstrates the scalability of hdWGCNA by analyzing a dataset containing nearly one million cells.

hdWGCNA provides a succinct methodology for investigating systems-level changes in the transcriptome in sc-datasets. The hdWGCNA workflow accounts for the considerations by collapsing highly similar cells into "metacells" to reduce sparsity while retaining cellular heterogeneity.


□ Theory of local k-mer selection with applications to long-read alignment

>> https://academic.oup.com/bioinformatics/advance-article/doi/10.1093/bioinformatics/btab790/6432031

An exact expression for calculating the conservation of a k-mer selection method. This turns out to be tractable enough for us to prove closed-form expressions for a variety of methods, including (open and closed) syncmers, (a, b, n)-words, and an upper bound for minimizers.

Modifying the minimap2 read aligner to use a more conserved k-mer selection method and demonstrate that there is up to an 8.2% relative increase in number of mapped reads.


□ sdcorGCN: Generating weighted and thresholded gene coexpression networks using signed distance correlation

>> https://www.cambridge.org/core/journals/network-science/article/generating-weighted-and-thresholded-gene-coexpression-networks-using-signed-distance-correlation/

sdcorGCN, a principled method to construct weighted gene coexpression networks using signed distance correlation. These networks contain weighted edges only between those pairs of genes whose correlation value is higher than a given threshold.

sdcorGCN constructs networks from signed distance correlations in combination with COGENT. A signed network with weights associated with its edges might include valuable information since the sign of the weights allow to differentiate positive and negative associations.


□ MTG-Link: leveraging barcode information from linked-reads to assemble specific loci

>> https://www.biorxiv.org/content/10.1101/2022.09.27.509642v1

The main feature of MTG-Link is that it takes advantage of the linked-read barcode information to get a subsample of reads of interest for the local assembly of each sequence.

MTG-Link can be used for various local assembly use cases, such as intra-scaffold and inter-scaffold gap-fillings, as well as the reconstruction of the alternative allele of large insertion variants.

The input of MTG-Link is a set of linked-reads, the target flanking sequences and coordinates in GFA format (genome graph format, with the flanking sequences identified as ”segment” elements (S lines) and the targets identified as ”gap” elements.

In MTG-Link, each target sequence is processed independently in a three-steps process: read subsampling using the barcode information of the linked-read dataset, local assembly by de Bruijn graph traversal and qualitative evaluation of the obtained assembled sequence.


□ R2Dtool: Positional interpretation of RNA-centric information in the context of transcriptomic and genomic features

>> https://www.biorxiv.org/content/10.1101/2022.09.23.509222v1

R2Dtool, a utility for long-read isoform-centric epitranscriptomics that annotates (epi)transcriptomic positions with transcript-specific metatranscript coordinates and proximity to adjacent splice-junctions.

R2Dtool transposes transcriptomic coordinates to their underlying genomic coordinates to enable the comparison of epitranscriptomic sites between overlapping transcript isoforms.

Using the transcriptomic positions of relevant sites provided in transcript-centric BED and the corresponding gene structures in GTF/GFF. R2_annotate.R calculates for each site of interest the distances to the available annotation features, such as the start and end of the ORF.


□ BoostDiff: Inference of differential gene regulatory networks from gene expression data using boosted differential trees

>> https://www.biorxiv.org/content/10.1101/2022.09.26.509450v1

BoostDiff is a non-parametric approach for reconstructing directed differential networks. BoostDiff modifies regression trees to use differential variance improvement (DVI) as the novel splitting criterion.

BoostDiff concentrates on maximizing the precision for those parts of the regulatory network that actually predict the difference between the two phenotypes. The network is inferred by building modified AdaBoost ensembles of differential trees as base learners.


□ SIMBSIG: Similarity search and clustering for biobank-scale data

>> https://www.biorxiv.org/content/10.1101/2022.09.22.509063v1

SIMBSIG is a GPU accelerated software tool for neighborhood queries, KMeans and PCA which mimics the sklearn API. SIMBSIG is imlemented a batched KNN search, and a radius neighbour search, where all neighbours within a user-defined radius are returned.

SIMBSIG uses a brute-force approach only due to the infeasibility of other exact methods in this scenario, while retaining most other functionality of scikit-learn such as the choice of a range of metrics including all lp distances.

The speed of SIMBSIG was benchmarked on an artificial dataset, where SNPs are encoded according to dominance assumption. They sampled “participants” represented by a 10, 000 dimensional vector with independent entries, representing 10, 000 SNPs with probabilities {0.6, 0.2, 0.2}.


□ MetaWorks: A flexible, scalable bioinformatic pipeline for high-throughput multi-marker biodiversity assessments

>> https://journals.plos.org/plosone/article?id=10.1371/journal.pone.0274260

MetaWorks provides a harmonized processing environment, pipeline, and taxonomic assignment approach for demultiplexed Illumina reads for all biota using a wide range of metabarcoding markers such as 16S, ITS, and COI.

MetaWorks uses VSEARCH ‘cluster_smallmem’ method to cluster ESVs using a 97% sequence similarity cutoff. Settings can be adjusted in the in the config_OTU.yaml file such as pointing to the directory that contains the ESVs and choosing a classifier for the OTUs.


□ DEGoldS: a workflow to assess the accuracy of differential expression analysis pipelines through gold-standard construction

>> https://www.biorxiv.org/content/10.1101/2022.09.13.507753v1

DEGoldS allows to test between multiple DE analysis pipelines and to select the one that produce less bias in DE inference. The way RSEM utilizes the information about the expression values to simulate libraries is very suitable for the gold-standard construction.

DEGoldS can accommodate to diverse pipeline configurations, it operates by testing several modifications to the widely used reference-guided StringTie pipeline and by performing two simulation scenarios: a simpler and less realistic one and a more realistic but more complex one.


□ NovGMDeep: Predicting Phenotypes From Novel Genomic Markers Using Deep Learning

>> https://www.biorxiv.org/content/10.1101/2022.09.21.508954v1

NovGMDeep, a one-dimensional (1D) deep convolutional neural network, to predict the different phenotypes from novel genomic markers-SVs and TEs. NovGMDeep learns the complex relationships between genome-wide markers and phenotypic traits from the training data.

The NovGMDeep model has four 1D convolutional layers, a single 1D max-pooling layer, a flatten layer and one dropout layer followed by a fully connected layer. rrBLUP and gBLUP were evaluated with the same data to compare their overall prediction performance with NovGMDeep.


□ voomQWB: Modelling group heteroscedasticity in single-cell RNA-seq pseudo-bulk data

>> https://www.biorxiv.org/content/10.1101/2022.09.12.507511v1

The methods that account for heteroscedastic groups, namely voomByGroup and voomQW using a blocked design, have superior perfor- mance in this regard when group variances are unequal.

voomQWB models group-wise mean-variance relationships via roughly parallel trend-lines, which has the disadvantage of not being able to capture more complicated shapes observed in different datasets. voomByGroup estimates distinct group-specific trends.


□ Genozip 14 - advances in compression of BAM and CRAM files

>> https://www.biorxiv.org/content/10.1101/2022.09.12.507582v1

Since CRAM aims to be an official standard, its development process is driven by a slow, consensus-oriented, multi-organisation collaboration, and it is purposely oblivious to the non-standard extensions of SAM tags introduced by tools developed to support various study types.

Genozip 14 demonstrates significantly superior compression of BAM and CRAM files compared to CRAM 3.1, and hence it would be a good choice for users seeking to minimise consumption of storage resources, for both archival purposes and for use in bioinformatics pipelines.


□ PeakCNV: A multi-feature ranking algorithm-based tool for genome-wide copy number variation-association study

>> https://www.sciencedirect.com/science/article/pii/S2001037022004068

PeakCNV, a novel AI based tool to correct this bias by distinguishing independent CNVR associations from that of confounding CNVRs within the same loci, resulting in identifying more accurate and biological meaningful list of CNVRs associated with phenotype of interest.

PeakCNV calculates a new metric, which we termed independence ranking score (IR-score) via a feature ranking algorithm. IR-score identifies a true positive CNVR when its significance of association is independent of any other overlapping or co-occurring CNVRs within that cluster.


□ Evaluation of classification in single cell atac-seq data with machine learning methods

>> https://bmcbioinformatics.biomedcentral.com/articles/10.1186/s12859-022-04774-z

These 6 traditional methods are all from the scikit-learn library: SVM with linear kernel, nearest mean classifier (NMC), random forest (RF), decision tree (DT), linear discriminant analysis (LDA) and k-nearest neighbor (KNN).

SVM performed best among all machine learning methods in intra-dataset experiments across most cell types in various datasets. In contrast, KNN no matter with setting 9 or 50 nearest neighbors performed poorly in all datasets with only a few cells are correctly characterized.


□ Gaussian graphical models with applications to omics analyses

>> https://onlinelibrary.wiley.com/doi/10.1002/sim.9546

The mathematical foundations of Gaussian graphical models (GGMs) are introduced with the goal of enabling the researcher to draw practical conclusions by interpreting model results.

Both the covariance matrix screening and the separate estimation of the K connected components of the GGM are tasks that are amenable to parallelization; thus problems that had previously been too large to be computationally tractable could be quickly solved.


□ GraphBio: A shiny web app to easily perform popular visualization analysis for omics data

>> https://www.frontiersin.org/articles/10.3389/fgene.2022.957317/full

GraphBio specifically focuses on facilitating the generation of publication-ready plots easily and rapidly instead of data preprocessing and computing. Users can easily prepare data to be visualized by Excel software based on given reference example files from GraphBio.

GraphBio provides 15 modules, incl. heatmap, volcano plots, MA plots, network plots, dot plots, chord plots, pie plots, four quadrant diagrams, Venn diagrams, cumulative distribution curves, PCA, survival analysis, ROC analysis, correlation analysis, and text cluster analysis.


□ Batch Normalization Followed by Merging Is Powerful for Phenotype Prediction Integrating Multiple Heterogeneous Studies

>> https://www.biorxiv.org/content/10.1101/2022.09.28.509843v1

A comprehensive workflow to simulate a variety of different types of heterogeneity and evaluate the performances of different integration methods together with batch normalization by using ComBat.

Combined with batch normalization, merging strategy and ensemble weighted learning methods both can boost machine learning classifier’s performance in phenotype predictions.

The rank aggregation methods should be considered as alternative way to boost prediction performances, given that these methods showed similar robustness as ensemble weighted learning methods.


□ DREAMS: Deep Read-level Error Model for Sequencing data applied to low-frequency variant calling and circulating tumor DNA detection

>> https://www.biorxiv.org/content/10.1101/2022.09.27.509150v1

DREAMS (Deep Read-level Modelling of Sequencing-errors) that incorporates both read-level and local sequence-context features for positional error rate estimation.

DREAMS-cc aggregates the signal across a catalogue of mutations for accurate estimation of the tumor fraction and sensitive determination of the overall cancer status.

DREAMS was built to exploit read-level features under the assumption that these affect the error rate in sequencing data. Thus, the power of this approach increases with the variability in the error rate explained by read level features.


□ Down the Penrose stairs: How selection for fewer recombination hotspots maintains their existence

>> https://www.biorxiv.org/content/10.1101/2022.09.27.509707v1

The loss of a small number of strong binding sites leads to the use of a greater number of weaker ones, resulting in a sharp reduction in symmetric binding and favoring new PRDM9 alleles that restore the use of a smaller set of strong binding sites.

This decrease in PRDM9 binding symmetry and in its ability to promote DSB repair drive the rapid zinc finger turnover. The advantage of new PRDM9 alleles is in limiting the number of binding sites used effectively, rather than in increasing net PRDM9 binding, as previously believed.


□ NanoCross: A pipeline that detecting recombinant crossover using ONT sequencing data

>> https://www.sciencedirect.com/science/article/pii/S0888754322002440

NanoCross first reduced sequencing errors and then constructed individual haplotypes based on homopolymer-filtered ONT sequences. Then, each molecule read is used to estimate cross recombination.

In the case of moderate heterozygous variation density and sequencing depth, NanoCross offers a good level of sensitivity. The last step was to detect the phase of the ONT reads using a sliding window method script with the BAM file and haplotype information as input.


□ RTX-KG2: a system for building a semantically standardized knowledge graph for translational biomedicine

>> https://bmcbioinformatics.biomedcentral.com/articles/10.1186/s12859-022-04932-3

RTX-KG2 is the first knowledge graph that integrates UMLS, SemMedDB, ChEMBL, DrugBank, Reactome, SMPDB, and 64 additional knowledge sources within a knowledge graph that conforms to the Biolink standard for its semantic layer and schema.

The RTX-KG2 system is a registered knowledge provider within Translator. To ensure that Translator’s various systems can interoperate, Biolink has been adapted as the semantic layer for concepts and relations for knowledge representation within the Translator project.


□ TIVAN-indel: A computational framework for annotating and predicting noncoding regulatory small insertion and deletion

>> https://www.biorxiv.org/content/10.1101/2022.09.28.509993v1

TIVAN- indel, which is an XGBoost-based supervised framework for scoring noncoding sindels based their potential to regulate the nearby gene expression.

TIVAN-indel leverages both generic CADD annotations and large-scale tissue/cell type-specific multi-omics features derived from deep learning model. TIVAN-indel achieves the best prediction in both cross-validation with-tissue prediction and independent cross-tissue evaluation.


□ wenda_gpu: fast domain adaptation for genomic data

>> https://academic.oup.com/bioinformatics/advance-article/doi/10.1093/bioinformatics/btac663/6747951

wenda_gpu uses GPyTorch to train models on genomic data within hours on a single GPU-enabled machine. wenda trains a model on the rest of the source data, and generates a confidence score based on how well that model is able to predict the observed feature values.

These confidence values are used as weighted penalties for the ultimate elastic net task, training the source data on the source labels. This script will train several models, a vanilla (unweighted) elastic net and with a variety of penalization amounts based on confidence score.


□ CelFEER: Cell type deconvolution of methylated cell-free DNA at the resolution of individual reads

>> https://www.biorxiv.org/content/10.1101/2022.09.30.510300v1

CelFEER (CELl Free DNA Estimation via Expectation-maximization on a Read resolution) uses essentially the same model as CelFiE but with read averages as input. This changes the underlying distributions of the model, while the overall structure of the algorithm remains the same.

CelFEER estimates of generated data correlate to true proportions. CelFEER is an efficient method that scales linearly in the size of the input and reference. The use of CelFEER in practical applications should be investigated further by testing the model on more cfDNA data.


□ READemption 2: Multi-species RNA-Seq made easy

>> https://www.biorxiv.org/content/10.1101/2022.09.30.510338v1

READemption 2.0 performs all necessary steps to handle RNA-seq data from any number of species, incl. quality filtering / adapter trimming / aligning the reads / generating nucleotide-wise coverage files / creating gene-wise read counts / performing differential GE analysis.

READemption 2.0 uses the alignment files (BAM files) of the initial alignment to generate template fragments from paired-end reads and writes them to a new BAM file containing the template fragments represented as single-end reads.


□ CNHplus: the chromosomal copy number heterogeneity which respects biological constraints

>> https://www.biorxiv.org/content/10.1101/2022.09.30.510279v1

A deficiency in CNH is pointed out. The absolute copy number (ACN) profile obtained by solving the CNH optimization problem may contain negative number of copies.

CNHplus corrects the flaw by imposing the non-negativity constraint. CNHplus is applied to survival stratification of patients from the TCGA studies. Also, it is discussed which other biological constraints should be incorporated into CNHplus.


□ GsRCL: Improving cell-type identification with Gaussian noise-augmented single-cell RNA-seq contrastive learning

>> https://www.biorxiv.org/content/10.1101/2022.10.06.511191v1

The GsRCL method consists of two stages of training. (a) The first stage is to use Gaussian noise N to create two views (s ̃1 and s ̃2) of the original input scRNA-seq expression profiles s.

These two new views are encoded by an encoder G and then projected into a latent space by a projector head H . Those two projected feature representations are pushed closer in the latent space by the contrastive learning loss.

GsRCL uses an SVM classifier and a validation dataset to select the optimal encoder whose generated feature representations lead to the highest predictive accuracy. The Gaussian noise augmentation method outperformed all random genes masking data augmentation methods.


□ The differential impacts of dataset imbalance in single-cell data integration

>> https://www.biorxiv.org/content/10.1101/2022.10.06.511156v1

Two key factors were found to lead to quantitation differences after scRNA-seq integration - the cell-type imbalance within and between samples (relative cell-type support) and the relatedness of cell-types across samples (minimum cell-type center distance).

This novel clustering metrics robust to sample imbalance, incl. the balanced Adjusted Rand Index (bARI) and balanced Adjusted Mutual Information (bAMI).

The calculation of the entropy and mutual information can proceed as-is after the normalization procedure, and this will balance the contributions from a presumed ground-truth partition in calculating the entropy and mutual information.

<bt />


□ MetaRNN: differentiating rare pathogenic and rare benign missense SNVs and InDels using deep learning

>> https://genomemedicine.biomedcentral.com/articles/10.1186/s13073-022-01120-z

MetaRNN and MetaRNN-indel, to help identify and prioritize rare nonsynonymous single nucleotide variants (nsSNVs) and non-frameshift insertion/deletions (nfINDELs).

MetaRNN / MetaRNN-indel scores are compatible, which filled another gap by providing a one-stop annotation score. This improvement is expected to be applicable across various settings, such as integrated rare-variant burden tests for genotype-phenotype association.


□ MAMBA: a model-driven, constraint-based multiomic integration method

>> https://www.biorxiv.org/content/10.1101/2022.10.09.511458v1

MAMBA (Metabolic Adjustment via Multiomic Blocks Aggregation), a CBM approach that enables the use of semi-quantitative metabolomic data together with a gene-centric omic data type, and the combination of different time points and conditions.

MAMBA captured known biology of heat stress in yeast and identified novel affected metabolic pathways. MAMBA was implemented as an integer linear programming (ILP) problem to guarantee efficient computation, and coded for MATLAB.


Covenant.

2022-10-17 22:10:10 | Science News


□ ortho2align: a sensitive approach for searching for orthologues of novel lncRNAs

>> https://bmcbioinformatics.biomedcentral.com/articles/10.1186/s12859-022-04929-y

ortho2align, a synteny-based approach for finding orthologues of novel lncRNAs with a statistical assessment of sequence conservation. ortho2align is in fact a versatile tool applicable to any genomic regions, especially weakly conserved ones, not just lncRNAs.

Implemented strategies of restricting the search to syntenic regions, statistical filtering of HSPs and selection of orthologues provide high levels of sensitivity and specificity as well as optimal computational time even when looking for orthologues in distant species.


□ Efficient Bayesian inference for stochastic agent-based models

>> https://journals.plos.org/ploscompbiol/article?id=10.1371/journal.pcbi.1009508

Using two agent-based models (ABMs) describing two distinct real-world problems: The first model deals with a malignant type of brain cancer called glioblastoma multiforme. The second model describes the spread of infectious diseases in a population.

Employing three different emulators: a deep neural network (NN), a mixture density network (MDN), and Gaussian processes (GP). These methods were chosen because they can mimic the stochastic nature of the ABMs


□ MultiVelo: Multi-omic single-cell velocity models epigenome-transcriptome interactions and improves cell fate prediction

>> https://www.nature.com/articles/s41587-022-01476-y

MultiVelo uses a probabilistic latent variable model to estimate the switch time and rate parameters of gene regulation, providing a quantitative summary of the temporal relationship between epigenomic and transcriptomic changes.

MultiVelo accurately recovers cell lineages and quantifies the length of priming and decoupling intervals in which chromatin accessibility and gene expression are temporarily out of sync.


□ sc-linker: Identifying disease-critical cell types and cellular processes by integrating single-cell RNA-sequencing and human genetics

>> https://www.nature.com/articles/s41588-022-01187-9

sc-linker, an integrated framework to relate human disease and complex traits to cell types and cellular processes by integrating GWAS summary statistics, epigenomics and scRNA-seq data from multiple tissue types, diseases, individuals and cells.

sc-linker links the genes underlying these programs to SNPs that regulate them by incorporating two tissue-specific, enhancer–gene-linking strategies: Roadmap Enhancer-Gene Linking and the Activity-by-Contact (ABC) model.


□ MAPCL: Estimation of Speciation Times Under the Multispecies Coalescent

>> https://academic.oup.com/bioinformatics/advance-article-abstract/doi/10.1093/bioinformatics/btac679/6760259

A maximum a posteriori estimator based on composite likelihood (MAPCL) for inferring these speciation times under a model of DNA sequence evolution for which exact site pattern probabilities can be computed under the assumption of a constant θ throughout the species tree.

MAPCL estimates are statistically consistent and asymptotically normally distributed, and we show how this result can be used to estimate their asymptotic variance. Use of the nonparametric bootstrap provides a more accurate estimate of the variance of the estimates.


□ DLoopCaller: A deep learning approach for predicting genome-wide chromatin loops by integrating accessible chromatin landscapes

>> https://journals.plos.org/ploscompbiol/article?id=10.1371/journal.pcbi.1010572

DLoopCaller transforms the task of detecting chromatin loops into a binary classification problem by using enriched experimental data such as ChIA-PET/HiChIP and Capture Hi-C as positive interactions and non-interaction regions as negative samples.

DLoopCaller mainly include the following aspects: (i) efficiently combining one dimensional (1D) open chromatin landscapes with 3D genomic data for chromatin loops prediction; (ii) improving the identification accuracy of chromatin loops on wider chromatin contact matrix.


□ KmerAperture: Retaining k-mer synteny for alignment-free estimation of within-lineage core and accessory differences

>> https://www.biorxiv.org/content/10.1101/2022.10.12.511870v1

KmerAperture takes the relative complements of a pair of whole genome k-mer sets and matches back to the enumerated k-mer lists to gain positional information. A new algorithm that w/ the few available axioms of how core and accessory sequence diversity is represented in k-mers.

KmerAperture was benchmarked against Jaccard similarity and ‘split k-mer analysis’ using a diverse lineage, a lower core diversity sub-lineage w/ a large accessory genome and a very low core diversity simulated population w/ accessory content not associated with number of SNPs.


□ GSA-MREMA: Random-effects meta-analysis of effect sizes as a unified framework for gene set analysis

>> https://journals.plos.org/ploscompbiol/article?id=10.1371/journal.pcbi.1010278

A unifying framework for GSA that first fits effect size distributions, and then tests for differences in these distributions between gene sets. These differences can be in the proportions of genes that are perturbed or in the sign or size of the effects.

In MRENA, the log fold change for genes in a given set is modeled as a mixture of Gaussian distributions, with distinct components corresponding to up-regulated, down-regulated and non-DE genes. MRENA uses the EM algorithm to estimate the parameters of this mixture distribution.

Inspired by meta-analysis, the standard error of the DE effect size estimate is incorporated into the estimation procedure, w/ genes w/ large standard errors having less influence on the parameter estimates than genes for which the DE effect is estimated with greater precision.


□ CMIC: predicting DNA methylation inheritance of CpG islands with embedding vectors of variable-length k-mers

>> https://bmcbioinformatics.biomedcentral.com/articles/10.1186/s12859-022-04916-3

CMIC (CGI Methylation Inheritance Classifier), a Gated Recurrent Units - based model to augment CGI sequence by converting it into variable-length k-mers, where the length k is randomly selected from the range kmin to kmax, N times, which were then used as neural network input.

splitDNA2vec is a new embedding vector generator for k-mers. The sequence of the embedding vectors is passed to a BiGRU layer to predict the DNA methylation status of the input sequence, which we designated as CGI methylation classification method CMIC.


□ CINS: Cell Interaction Network inference from Single cell expression data:

>> https://journals.plos.org/ploscompbiol/article?id=10.1371/journal.pcbi.1010468

CINS combines Bayesian network learning with constrained regression analysis. CINS scRNA-Seq data from multiple samples of a similar condition to learn Bayesian networks which highlight the cell types whose distributions are co-varying under different conditions.

CINS discretizes the data for each cell type using a Gaussian Mixture Model with only two components and learns a BN that models the joint probability distribution of the cell type mixtures. High scoring differential causal relationships are determined based on bootstrapping.


□ Deep6: Classification of Metatranscriptomic Sequences into Cellular Empires and Viral Realms Using Deep Learning Models

>> https://www.biorxiv.org/content/10.1101/2022.09.13.507819v1

Deep6 is trained on reference coding sequences, but classification of query sequences is done reference-independent and alignment-free. The provided model is optimized for marine samples and can process sequences as short as 250 nucleotides.

Deep6 is a multi-class Convolutional Neural Network (CNN) model, consisting of 500 convolutions, 500 dense layers, a default kernel size of ten and a maximum of 40 epochs of training.


□ Prophaser: A joint use of pooling and imputation for genotyping SNPs

>> https://bmcbioinformatics.biomedcentral.com/articles/10.1186/s12859-022-04974-7

IMPUTE2 and MACH form the HMM hidden states by selecting h template haplotypes, such there is a constant number h^2 hidden states at each of the j diploid markers. Hence, these methods have a complexity O(jh^2) in time for individual, and the time complexity grows linearly.

A statistical framework that formalizes pooling as a mathematical transformation of the genotype data. Prophaser algorithm, the coalescence assumption supports an imputation model that delivers high accuracy in pooled genotype reconstruction.


□ Transcription factor expression is the main determinant of variability in gene co-activity

>> https://www.biorxiv.org/content/10.1101/2022.10.11.511770v1

Focusing specifically on co-activity domains with variable co-activity between individuals to study the regulatory mechanisms driving co-activity, including genotype, TF abundance, and chromatin interactions.

Via approximate Bayesian modeling, expression count data, quantified in 10 kb genomic bins, are decomposed into a co-activity component, which is positionally dependent, and a positionally independent component. The co-activity component is modeled as a first-order random walk.


□ mHapTk: A comprehensive toolkit for the analysis of DNA methylation haplotypes

>> https://academic.oup.com/bioinformatics/advance-article-abstract/doi/10.1093/bioinformatics/btac650/6731920

The DNA methylation status of CpG sites on the same fragment represents a discrete methylation haplotype (mHap). However, most existing tools focus on average methylation and ne-glect mHap patterns.

mhapTk calculates eight mHap-level summary statistics in predefined regions or across individual CpG in a genome-wide manner. It identifies methylation haplotype blocks (MHBs), in which methylation of pairwise CpGs are tightly correlated.


□ Major cell-types in multiomic single-nucleus datasets impact statistical modeling of links between regulatory sequences and target genes

>> https://www.biorxiv.org/content/10.1101/2022.09.15.507748v1

The Z-scores method results in a strong loss of power to detect the regulatory effect of cCREs with high read counts in the most abundant cell-type(s). A strong loss of power to detect a regulatory effect for cCREs with high read counts in the dominant cell-type.

This is largely due to cell-type-specific trans-ATACseq peak correlations creating bimodal null distributions. the raw Pearson correlation coefficients and/or physical distance is computationally advantageous and provides the best predictions of “ATACseq peak-target gene” links.


□ Identifying and correcting repeat-calling errors in nanopore sequencing of telomeres

>> https://genomebiology.biomedcentral.com/articles/10.1186/s13059-022-02751-6

Telomeric regions were frequently miscalled as other types of repeats in a strand-specific manner. Specifically, although human telomeres are typically represented by (TTAGGG)n repeats, these regions were frequently recorded as (TTAAAA)n repeats.

These artefacts were not observed on the CHM13 reference genome, or PacBio HiFi reads from the same site, suggesting that these observed repeats are artefacts of nanopore sequencing or the base-calling process

The examination of each telomeric long read also indicates that these error repeats frequently co-occur with telomeric repeats at the ends of each read, and are observed on all chromosomal arms of CHM13.


□ SCRIP: Single-cell gene regulation network inference by large-scale data integration

>> https://academic.oup.com/nar/advance-article/doi/10.1093/nar/gkac819/6717821

SCRIP infers single-cell TR activity and targets based on the integration of scATAC-seq and a large-scale TR ChIP-seq reference. SCRIP enables identifying TR target genes as well as building GRNs at the single-cell resolution based on a regulatory potential model.

SCRIP takes the scATAC-seq peak by count matrix or bin count matrix as input. SCRIP calculates the number of peak overlaps b/n each cell and the ChIP-seq peaks set or motif-scanned intervals set. SCRIP enables the trajectory analyses of scATAC-seq with known driver TR activity.


□ NetLCP: An R package for prioritizing combinations of regulatory elements in the heterogeneous network with variant 'switches' detection

>> https://www.biorxiv.org/content/10.1101/2022.10.06.511229v1

NetLCP prioritizes CREs by highlighting regulatory elements and detecting regulatory ‘switches’ in the heterogeneous network. By leveraging multidimensional biological knowledge, it provides a meaningful perspective on user-interested biological processes or functions.

NetLCP highlights regulatory elements (lncRNA, circRNA, KEGGPath, ReactomePath and WikipathwayPath) in the heterogeneous network, which have similar biological functions to the given input transcriptome (miRNA/mRNA).

NetLCP produces a tab-delimited text files which records the prioritized elements with column names of lncRNA/circRNA/pathway ID, FunScore, OfficialName and Empirical P-value.


□ PhylinSic: Phylogenetic inference from single-cell RNA-seq data

>> https://www.biorxiv.org/content/10.1101/2022.09.27.509725v1

PhylinSic is robust to the low read depth, drop-out, and noisiness of scRNA-Seq data. This method called nucleotide bases from scRNA-Seq reads using a probabilistic smoothing approach, and then estimated a phylogenetic tree using a Bayesian modeling algorithm.

PhylinSic first identified sites that varied across the cells and thus might best reveal phylogenetic structure. PhylinSic assigns reference and alternate bases according to the base seen in the alignments, and if the genotype was heterozygous, it assigns an arbitrary surrogate base. Finally, to estimate the phylogeny of the cells, using BEAST2.


□ TAMC: A deep-learning approach to predict motif-centric transcriptional factor binding activity based on ATAC-seq profile

>> https://journals.plos.org/ploscompbiol/article?id=10.1371/journal.pcbi.1009921

TAMC (Transcriptional factor binding prediction from ATAC-seq profile at Motif-predicted binding sites using Convolutional neural networks) predicts motif-centric TF binding activity from paired-end ATAC-seq data. TAMC does not require bias correction during signal processing.

By leveraging a one-dimensional convolutional neural network (1D-CNN) model, TAMC make predictions based on both footprint and non-footprint features and outperforms existing footprinting tools in TFBS prediction particularly for ATAC-seq data with limited sequencing depth.


□ q2-fondue: Reproducible acquisition, management, and meta-analysis of nucleotide sequence (meta)data

>> https://academic.oup.com/bioinformatics/advance-article/doi/10.1093/bioinformatics/btac639/6706785

q2-fondue allows fully provenance-tracked programmatic access to and management of data from the NCBI Sequence Read Archive (SRA).

q2-fondue enables full data provenance tracking from data download to final visualization, integrates with the QIIME 2 ecosystem, prevents data loss upon space exhaustion, and allows download of (meta)data given a publication library.


□ ShIVA, a user-friendly and interactive interface giving biologists control over their single-cell RNA-seq data.

>> https://www.biorxiv.org/content/10.1101/2022.09.20.508636v1

ShIVA supports cell hashing analysis and provides great flexibility in visualization, whether by dimensionality reduction maps, boxplots, violin plots, histograms, density plots, or count tables.

ShIVA keeps track of the user’s choice by defining a hierarchy of sub-projects, each of them containing the results of different user choices. Switching between sub-projects allows for comparison of analysis processes to optimize the deciphering of the dataset.


□ msPIPE: a pipeline for the analysis and visualization of whole-genome bisulfite sequencing data

>> https://bmcbioinformatics.biomedcentral.com/articles/10.1186/s12859-022-04925-2

The msPIPE pipeline consists of pre-processing, alignment & methylation calling, and methylation analysis & visualization steps. It generates a DNA methylation profile for each sample, which is a unit of analysis defined by user.

The msPIPE can be used to treat one or more replicates for each sample. In brief, the required reference files are prepared using the given UCSC assembly name of a reference, and the input bisulfite sequencing reads in each sample are trimmed first.


□ Genome Informatics 2022 #GI2022

>> https://coursesandconferences.wellcomeconnectingscience.org/event/genome-informatics-20220921/

Wellcome Connecting Science Courses RT

Get ready for 3 days of inspiring discussion and networking at Genome Informatics 2022! 🙌

A huge welcome to all our delegates: 106 in-person & 432 online, joining us from 72 countries. 

Make sure to Tweet your community using #GI2022 and tag in @eventsWCS


□ Verticall: Tool for recombination-free phylogrnies:

>> https://github.com/rrwick/Verticall/tree/main/verticall

Assemblies as input / Makes a distance matrix / points the genomes vertical / horizontal #GI2022


□ IBRAP: Integrated Benchmarking Single-cell RNA-sequencing Analytical Pipeline

>> https://www.biorxiv.org/content/10.1101/2022.09.26.509481v1

IBRAP contains a range of analytical components that can be interchanged throughout the pipeline alongside multiple benchmarking metrics that enables users to compare results and determine the optimal pipeline combinations for their data.

IBRAP performs clustering, trajectory inference and automated cell labelling. Within the clustering step, a selection of popular clustering techniques was integrated, including k-means, PAM, SC3, Louvain, Louvain with Multilevel Refinement, Smart Local Moving, and Leiden.


□ SNPAAMapper-Python: A highly efficient genome-wide SNP variant analysis pipeline for Next-Generation Sequencing data

>> https://www.frontiersin.org/articles/10.3389/frai.2022.991733/full

In the Python version of SNPAAMapper, the second script for processing exon annotation files and generating feature start and gene mapping files performs extremely better than the one in the original Perl version.

Steps of predicting amino acid change type and prioritizing mutation effects of variants were executed within 1 s for both pipelines. SNPAAMapper-Python was developed and tested on the ClinVar database, a NCBI database of information on genomic variation.


□ Xenium: High resolution, high-target analysis

>> https://www.10xgenomics.com/in-situ-technology

The Xenium workflow starts with sectioning tissues onto a microscope slide. The sections are then treated to access the RNA for labeling with circularizable DNA probes.

Ligation of the probes then generates a circular DNA probe which is enzymatically amplified and bound with fluorescent oligos that has a high signal-to-noise ratio. An optical signature specific to each gene is generated, enabling identification of the target gene.


□ A workflow reproducibility scale for automatic validation of biological interpretation results.

>> https://www.biorxiv.org/content/10.1101/2022.10.11.511695v1

A new metric, a reproducibility scale of workflow execution results, to evaluate the reproducibility of results. This metric is based on the idea of evaluating the reproducibility of results using biological feature values representing their biological interpretation.

The workflow built by the workflow developer is executed by WES, which is a combination of Sapporo and Yevis, and the workflow provenance, including feature values of the output files, is generated in RO-Crate format.

Using Tonkaz, the user then compares the shared provenance with the provenance generated by the user’s workflow execution and verifies the reproducibility.


□ scGNN 2.0: a graph neural network tool for imputation and clustering of single-cell RNA-Seq data

>> https://academic.oup.com/bioinformatics/advance-article-abstract/doi/10.1093/bioinformatics/btac684/6762077

The implementation of scGNN 2.0 is significantly faster than scGNN thanks to a simplified close-loop architecture. Cell clustering performance was increased by 85.02% on average in terms of adjusted rand index, and the imputation Median L1 Error was reduced by 67.94% on average.


NASA Webb Telescope RT

Hey Neptune. Did you ring? 👋

Webb’s latest image is the clearest look at Neptune's rings in 30+ years, and our first time seeing them in infrared light. Take in Webb's ghostly, ethereal views of the planet and its dust bands, rings and moons: go.nasa.gov/3RXxoGq #IAC2022

>> https://www.nasa.gov/feature/goddard/2022/new-webb-image-captures-clearest-view-of-neptune-s-rings-in-decades


□ Samantha Cristoforeti RT

>> https://twitter.com/astrosamantha/status/1572600896038526977?s=21&t=YABVz4FJdfY_W1IKQXF2nA

We had a spectacular view of the #Soyuz launch!
Sergey, Dmitry and Frank will come knocking on our door in just a couple of hours… looking forward to welcoming them to their new home! #MissionMinerva


□ Nicolas Robine RT

>> https://twitter.com/notsojunkdna/status/1568265804658909187?s=21&t=rVGpMaySUH1R1C8hf9T-_g
>> http://haymakersforhope.org/event/new-york

With @polyethnic1000, we're fighting against cancer health disparity, but this young fellow is doing it literally (with boxing gloves), and fundraising for the project. Please support Rahul's effort!


□ Anna Cuomo RT

>> https://www.singlecells.org.au/
>> https://twitter.com/annasecuomo/status/1570672816093278210?s=21&t=rVGpMaySUH1R1C8hf9T-_g

An absolute pleasure attending and presenting at my first Oz conference! Amazing science and a stunning location 🧬🌊 #ozsinglecell22


Inheritant.

2022-10-17 22:09:08 | Science News


□ WMSA: a novel method for multiple sequence alignment of DNA sequences

>> https://academic.oup.com/bioinformatics/advance-article-abstract/doi/10.1093/bioinformatics/btac658/6731927

MAFFT has adopted the FFT method for searching the homologous segments and using them as anchors to divide the sequences, then making alignment only on segments, which can save time and memory without overly reducing the sequence alignment quality.

WMSA uses the divide-and-conquer method to split the sequences into clusters, aligns those clusters with the center star strategy, and then makes a profile-profile alignment. The alignment is conducted by the compiled algorithms of MAFFT, K-Band with multithread parallelism.


□ Fast computation of principal components of genomic similarity matrices

>> https://www.biorxiv.org/content/10.1101/2022.10.06.511168v1

The eigenvectors of three similiary matrices (the genetic covariance matrix, the weighted Jaccard matrix, and the genomic relationship matrix) can be computed efficiently by rewriting their computations in a unified way which allows for an exact, faster computation.

A tailored algorithm by adapting an existing randomized singular value decomposition (SVD) algorithm. The algorithm never actually computes a similarity matrix and fully supports sparse matrix algebra for efficient calculations.

An approximate Jaccard matrix which likewise allows for an efficient computation of its eigenvectors w/o actually computing the similarity measure. They create sparse matrices G of dimensions n×m, where a proportion π ∈ [0, 1] of entries is set to one, acting as nonzero alleles.


□ VarSum: Genomic data integration and user-defined sample-set extraction for population variant analysis

>> https://bmcbioinformatics.biomedcentral.com/articles/10.1186/s12859-022-04927-0

VarSum applies to possibly any genomic variation collection of data. They defined a minimal set of categories of region data attributes, considered essential for any variant definition.

The META-BASE repository is accessible through the GMQL interface, where datasets of several integrated genomic data sources are available. GMQL provides cloud computation queries over several samples in parallel, taking into account genomic region positions / distances.


□ DeepBIO is an automated and interpretable deep-learning platform for biological sequence prediction, functional annotation, and visualization analysis

>> https://www.biorxiv.org/content/10.1101/2022.09.29.509859v1

DeepBIO provides a comprehensive result visualization analysis for the predictive models covering several aspects, such as model interpretability, feature analysis, and functional sequential region discovery.

DeepBIO integrates over 40 deep-learning algorithms, incl. convolutional neural networks, advanced natural language processing models, and graph neural networks, which enables to train, compare, and evaluate different architectures on any biological sequence data.


□ HAYSTAC: A Bayesian framework for robust and rapid species identification in high-throughput sequencing data

>> https://journals.plos.org/ploscompbiol/article?id=10.1371/journal.pcbi.1010493

High-AccuracY and Scalable Taxonomic Assignment of MetagenomiC data (HAYSTAC), which can estimate the probability that a specific taxon is present in a metagenome.

HAYSTAC uses a novel Bayesian framework to infer the abundance and statistical support for each species identification and provide per-read species classification. HAYSTAC is specifically designed to efficiently handle both ancient and modern DNA data.


□ Treenome Browser: co-visualization of enormous phylogenies and millions of genomes

>> https://www.biorxiv.org/content/10.1101/2022.09.28.509985v1

Treenome Browser uses an innovative phylogenetic compression technique to interactively display the genome of each sample aligned with its phylogenetic position, remaining performant on trees with over 12 million sequences.

Treenome Browser displays mutations as vertical lines spanning the mutation’s presence in the phylogeny, drawn at their horizontal position. The tree is traversed from root to leaves. Its mutations are drawn across the pre-computed vertical span of its descendant clade.


□ TACCO: Unified annotation transfer and decomposition of cell identities for single-cell and spatial omics

>> https://www.biorxiv.org/content/10.1101/2022.10.02.508471v1

TACCO (Transfer of Annotations to Cells and their COmbinations), a fast and flexible computational decomposition framework. TACCO takes as input an unannotated dataset consisting of observations and corresponding reference dataset with annotations in a reference representation.

TACCO uses Bhattacharyya coefficients as a similarity metric, which are formally equivalent to the overlaps of probability amplitudes in quantum mechanics, and closely related to expectation values of measurements.

TACCO provides the boosters: Platform normalization to scaling factors in the transformation; Sub-clustering w/ multiple-centers; Bisectioning for recursive annotation, assigning only part of the annot. and working w/ the residual to increase sensitivity to sub-dominant annot.


□ MagicalRsq: Machine-learning-based genotype imputation quality calibration

>> https://www.cell.com/ajhg/fulltext/S0002-9297(22)00412-8

MagicalRsq, a machine-learning-based genotype imputation quality calibration, by using eXtreme Gradient Boosted trees (XGBoost) to effectively incorporate information from various variant-level summary statistics.

MagicalRsq requires true R2 information for a subset of individuals and/or a subset of markers (refer to both as additional genotypes) to train models that can be applied to all target individuals and all markers.


□ Flaver: mining transcription factors in genome-wide transcriptome profiling data using weighted rank correlation statistics

>> https://www.biorxiv.org/content/10.1101/2022.10.02.510575v1

Flaver uses the weighted Kendall's tau statistic in a serial of weight functions. The statistical inference on the key TF is based on comparing the ranked gene-sets and ranked gene-list by an informative top-down algorithm based on weighted Kendall’s rank correlation coefficient.

The Flaver algorithm make sense naturally since the higher-ranking genes in the gene-set tend to be truly TF targets and these genes should be emphasized, on the other hand, the lower-ranking genes in the gene-set tend to be false positives and these genes should be deemphasized.


□ CAFE (Cohort Allele Frequency Estimation) Pipeline: A workflow to generate a variant catalogue from Whole Genome Sequences

>> https://www.biorxiv.org/content/10.1101/2022.10.03.508010v1

CAFE pipeline includes detection of single nucleotide variants, small insertions and deletions, mitochondrial variants, structural variants, mobile element insertions, and short tandem repeats.

SNV and indel sub-workflow takes as input a reference genome and bam files and outputs one vcf file with filtered annotated variant frequencies. Individual / cohort vcf files are generated with the genotype of each individual for each variant, before and after variant filtration.


□ ncRNAInter: a novel strategy based on graph neural network to discover interactions between lncRNA and miRNA

>> https://academic.oup.com/bib/advance-article-abstract/doi/10.1093/bib/bbac411/6747810

ncRNAInter was robust and showed better performance of 26.7% higher Matthews correlation coefficient than existing reputable methods for human LMI prediction.

ncRNAInter proved its universal applicability in dealing with LMIs from various species and successfully identified novel LMIs associated with various diseases, which further verified its effectiveness and usability.


□ MrVI: Deep generative modeling for quantifying sample-level heterogeneity in single-cell omics

>> https://www.biorxiv.org/content/10.1101/2022.10.04.510898v1

MrVI posits cells as being generated from nested experimental designs. MrVI scales easily to millions of cells due to its reliance on variational inference, implemented with a hardware-accelerated and memory-efficient stochastic gradient descent training procedure.

MrVI provides a normalized view of each cell at two levels. The first level is a low-dimensional stochastic embedding of each cell that is decoupled from its sample-of-origin and any additional known technical factors.

This embedding space primarily reflects cell-state properties that are common across samples and can be used to identify biologically-coherent cell groups.


□ scHiCPTR: unsupervised pseudotime inference through dual graph refinement for single-cell Hi-C data

>> https://academic.oup.com/bioinformatics/advance-article-abstract/doi/10.1093/bioinformatics/btac670/6751779

scHiCPTR provides a workflow consisting of imputation and embedding, graph construction, dual graph refinement, pseudotime calculation and result visualization.

scHiCPTR ties to optimize graph structure by two parallel procedures of graph pruning, which help reduce the spurious cell links resulted and determine a global developmental directionality. scHiCPTR reconciles pseudotime inference in the case of circular / bifurcating topology.


□ pLMMGMM: A penalized linear mixed model with generalized method of moments estimators for complex phenotype prediction

>> https://academic.oup.com/bioinformatics/advance-article-abstract/doi/10.1093/bioinformatics/btac659/6751772

pLMMGMM is built within the linear mixed model framework, where random effects are used to model the joint predictive effects from all variants within a region. pLMMGMM can efficiently detect regions that harbour genetic variants with both linear and non-linear predictive effects.

pLMMGMM is much less computationally demanding. It can jointly consider a large number of regions and accurately detect those that are predictive. pLMMGMM has the selection consistency and asymptotic normality.


□ vamos: VNTR annotation using efficient motif sets

>> https://www.biorxiv.org/content/10.1101/2022.10.07.511371v1

Vamos is a tool to perform run-length encoding of VNTR sequences using a set of selected motifs from all motifs observed at that locus. Vamos guarantees that the encoding sequence is winthin a bounded edit distance of the original sequence.

Vamos can generate annotation for haplotype-resolved assembly at each VNTR locus, given a set of motifs at that VNTR locus. Vamos can generate annotation for aligned reads (phased or unphased) at each VNTR locus.

For each assembly, VNTR sequences were lifted-over and decomposed into motifs by Tandem Repeats Finder (TRF). Post-filtering step leaves 467104 well-resolved VNTR loci.


□ BioDiscViz : a visualization support and consensus signature selector for BioDiscML results

>> https://www.biorxiv.org/content/10.1101/2022.10.07.511250v1

BioDiscViz takes as input a directory containing BioDiscML output in csv format and their summary results. The best model and the classification or regression results are independently accessible.

Considering that non-numerical features cannot be easily integrated into PCA and heatmap with other numerical values, a particularity of BioDiscViz is the transformation of categorical features into numerical ones.


□ MAST: Phylogenetic Inference with Mixtures Across Sites and Trees

>> https://www.biorxiv.org/content/10.1101/2022.10.06.511210v1

MAST uses a mixture of bifurcating trees to represent multiple histories in a single concatenated alignment. It allows each tree to have its own topology, branch lengths, substitution model, nucleotide or amino acid frequencies, and model of rate heterogeneity across sites.

They implemented the MAST model in a maximum-likelihood framework in the IQ-TREE. The MAST model is able to analyse a concatenated alignment using maximum likelihood, while avoiding some of the biases that come with assuming there is only a single tree.


□ NetTDP: permutation-based true discovery proportions for differential co-expression network analysis

>> https://academic.oup.com/bib/advance-article-abstract/doi/10.1093/bib/bbac417/6754043

Permutation-based Network True Discovery Proportions (NetTDP), is proposed to quantify the number of edges (correlations) or nodes (genes) for which the co-expression networks are different.

In the NetTDP method, they propose an edge-level statistic and a node-level statistic, and detect true discoveries of edges and nodes in the sense of differential co-expression network, respectively, by the permutation-based sumSome method.


□ DeepLncPro: an interpretable convolutional neural network model for identifying long non-coding RNA promoters

>> https://academic.oup.com/bib/advance-article-abstract/doi/10.1093/bib/bbac447/6754194

Only few computational methods have been proposed for lncRNA promoter prediction and their performances still have room to be improved.

DeepLncPro has the ability to extract and analyze transcription factor binding motifs from lncRNAs, which made it become an interpretable model. DeepLncPro can server as a powerful tool for identifying lncRNA promoters.


□ SPECK: An Unsupervised Learning Approach for Cell Surface Receptor Abundance Estimation for Single Cell RNA-Sequencing Data

>> https://www.biorxiv.org/content/10.1101/2022.10.08.511197v1

SPECK is a promising approach for unsuper- vised estimation of surface receptor abundance for scRNA- seq data that addresses limitations of existing imputation methods such as ALRA and MAGIC.

Similar to ALRA, the SPECK method utilizes a singular value decomposition (SVD)-based RRR but includes a novel approach for thresholding of the reconstructed gene expression matrix that improves receptor abundance estimation.


□ kimma: flexible linear mixed effects modeling with kinship for RNA-seq data

>> https://www.biorxiv.org/content/10.1101/2022.10.10.508946v1

kimma (Kinship In Mixed Model Analysis), an open-source R package for flexible linear mixed effects modeling of RNA-seq including covariates, weights, random effects, covariance matrices, and fit metrics.

kimma supports covariance matrices as well as fit metrics like AIC. Utilizing genetic kinship covariance, kimma revealed that kinship impacts model fit and DEG detection. kimma equals or outcompetes current DEG pipelines in sensitivity, computational time, and model complexity.


□ RCL: Fast multi-resolution consensus clustering

>> https://www.biorxiv.org/content/10.1101/2022.10.09.511493v1

Restricted Contingency Linkage (RCL), a parameter-free consensus method that uniquely integrates and reconciles a set of flat clusterings with potentially widely varying levels of granularity into a single multi-resolution view.

An RCL reference implementation is provided for clustering ensembles that are associated with a network G, further restricting the RCL matrix to entries that correspond to edges in G.

For a network G with m edges this implementation has complexity O(m(p2+log(m))) where p is the number of input clusterings, taking less than a minute on a dataset with N=27k elements, m=1.5M edges and p=24 clusterings.


□ Tree2GD: A Phylogenomic Method to Detect Large Scale Gene Duplication Events

>> https://academic.oup.com/bioinformatics/advance-article-abstract/doi/10.1093/bioinformatics/btac669/6758243

Tree2GD, an integrated method to identify large scale gene duplication events by automatically perform multiple procedures, including sequence alignment, recognition of homolog, gene tree/species tree reconciliation, Ks distribution of gene duplicates and synteny analyses.

Application of Tree2GD on two datasets, 12 metazoan genomes and 68 angiosperms, successfully identifies all reported whole-genome duplication events exhibited by these species, showing effectiveness of Tree2GD on phylogenomic analyses of large-scale gene duplications.