


 (165 million year old fossil octopus from France.))
“Life is but a dream full of starts of folly, and of fancied, and true miseries. Death awakes us from this painful dream, and gives us, either a better existence or no existence at all.”
Paradoxは超えられるべき認知上の壁であり、しばしば既知の理論の劇的な転回を伴う。

□ Thresholding normally distributed data creates complex networks:
>> https://arxiv.org/pdf/1902.08278.pdf
a simple generative model for continuous valued relational data and study the network ensemble obtained by thresholding it. Despite the simplicity of the model—all the underlying relational data is normally distributed. some, but not all, of the properties associated with complex networks can be seen after thresholding, even though the underlying data is not “complex”.
heavy-tailed degree distributions, large numbers of triangles, and short path lengths, while we do not observe non-vanishing clustering or community structure.

□ ChromA: Characterizing the epigenetic landscape of cellular populations from bulk and single-cell ATAC-seq information:
>> https://www.biorxiv.org/content/biorxiv/early/2019/03/04/567669.full.pdf
ChromA, a Bayesian statistical approach that models ATAC-seq information to infer chromatin accessibility landscape and annotate open (accessible) and closed (inaccessible) chromatin regions. ChromA harnesses recent developments in hidden semi-Markov models to create a scalable statistical inference method that can be applied to genome wide experiments.

□ Nebula: Ultra-efficient mapping-free structural variant genotyper:
>> https://www.biorxiv.org/content/biorxiv/early/2019/03/04/566620.full.pdf
Nebula utilizes the changes in the count of k-mers to predict the genotype of common structural variations. Nebula relies on CPLEX to generate and solve the linear program. The main phase of the Nebula and the crux of the method is the genotyping stage. Provided the set of k-mers associated with the input SVs, Nebula will count these k-mers in the WGS for genotyping. A final rounding converts the real genotype values to 3 states of 0/0, 0/1 or 1/1.

□ GPseudoClust: deconvolution of shared pseudo-trajectories at single-cell resolution:
>> https://www.biorxiv.org/content/biorxiv/early/2019/03/05/567115.full.pdf
GPseudoClust, is a novel approach that both clusters genes for pseudotemporally ordered data and quantifies the uncertainty in cluster allocations arising from the uncertainty in the pseudotime ordering. GPseudoClust combines a recent method for pseudo-time inference with nonparametric Bayesian clustering methods, efficient MCMC sampling, and novel subsampling strategies. For branching data, GPseudoClust identifies differences in dynamic patterns for different branches.

□ cGAUGE: Constraint-based analysis for causal discovery in population-based biobanks:
>> https://www.biorxiv.org/content/biorxiv/early/2019/03/04/566133.full.pdf
cGAUGE, a new pipeline for causal Graphical Analysis Using GEnetics that utilizes large changes in the significance of local conditional independencies between the genetic instruments and the phenotypes. search for new graphical patterns to reveal novel information about the underlying causal diagram that is not covered by extant methods, including new direct links, colliders, and evidence for confounding.
□ EpiAlign: an alignment-based bioinformatic tool for comparing chromatin state sequences:
>> https://www.biorxiv.org/content/biorxiv/early/2019/03/04/566299.full.pdf
EpiAlign is a dynamic programming al- gorithm that novelly incorporates varying lengths and frequencies of chromatin states. EpiAlign is able to extract recurrent chromatin state patterns along a single epigenome, and many of these patterns carry cell-type-specific characteristics.

□ Genetic and environmental perturbations lead to regulatory decoherence:
>> https://elifesciences.org/articles/40538
The environmental exposures (infection and disease) lead to a systematic loss of correlation, which they define as 'decoherence'. ‘Correlation by Individual Level Product’ (CILP), for each individual the product between two traits is estimated and modeled as a continuous outcome variable.

□ A topological data analysis based classification method for multiple measurement:
>> https://www.biorxiv.org/content/biorxiv/early/2019/03/06/569210.full.pdf
a multiple measurement case, take one data point in a tree data set to be a branch of the tree with different features extracted from the Quantitative Structural Modelling (QSM) model. For 6 point process, the alternate SVM classifier appears to maintain accuracy with two of the tree species, while confusing the other four species in a consistent basis, leading to the nearly constant 33% cross-validation accuracy.
This surprising phenomenon possibly reflects a large variation in the data which does not lead to data organization which is accurately partitioned by a hyperplane. Similarly, a potential explanation for the TDA classifier’s high accuracy with more point process classes is that differences in datapoint location in multi-dimensional space could require tools to tease out clusters based on similar geometry.

□ Sequential compression across latent space dimensions enhances gene expression signatures:
>> https://www.biorxiv.org/content/biorxiv/early/2019/03/11/573782.full.pdf
Ensembles of features from different unsupervised algorithms (PCA, ICA, non-negative matrix factorization(NMF), denoising autoencoder, and variational autoencoder (VAE) models) discover biological signatures in large transcriptomic datasets. To enhance biological signature discovery, rather than compressing input data into a single pre-selected dimensionality, it is best to perform compression on input data over many latent dimensionalities.
□ Feature Selection and Dimension Reduction for Single Cell RNA-Seq based on a Multinomial Model:
>> https://www.biorxiv.org/content/biorxiv/early/2019/03/11/574574.full.pdf
Simple multinomial methods incl. generalized principal component analysis (GLM-PCA) for non-normal distributions, and feature selection using deviance. These methods outperform current practice in a downstream clustering assessment using ground-truth datasets. Dimension reduction via GLM-PCA, or its fast approximation using residuals from a multinomial model, leads to better clustering performance than PCA on z-scores of log-CPM.
The GLM-PCA method is most concordant to the data generating mechanism since all aspects of the pipeline are integrated into a coherent model rather than being dealt with through sequential normalizations and transformations.
□ aphid: an R package for analysis with profile hidden Markov models:
>> https://academic.oup.com/bioinformatics/advance-article-abstract/doi/10.1093/bioinformatics/btz159/5370175
aphid can be used to derive, import and export HMMs and profile HMMs in the R environment. Computationally-intensive dynamic programming recursions such as the Viterbi, forward and backward algorithms are implemented in C ++ and parallelized for increased speed and efficiency.
□ MetaMLP: A fast word embedding based classifier to profile target gene databases in metagenomic samples:
>> https://www.biorxiv.org/content/biorxiv/early/2019/03/06/569970.full.pdf
MetaMLP enables partial matching by using a reduced alphabet to build sequence embeddings from full and partial kmers. MetaMLP is able to identify a slightly larger number of reads compared to Diamond as well as to perform accurate predictions with 0.99 precision and 0.99 recall. MetaMLP can process 100M reads in around 10 minutes in a laptop computer which is 50x faster than Diamond.

□ DEPECHE: Determination of essential phenotypic elements of clusters in high-dimensional entities:
>> https://journals.plos.org/plosone/article?id=10.1371/journal.pone.0203247
DEPECHE, a rapid, parameter free, sparse k-means-based algorithm for clustering of multi- and megavariate single-cell data. In a number of computational benchmarks aimed at evaluating the capacity to form biologically relevant clusters, incl scRNA-seq data w/ manually curated gold standard solutions, DEPECHE clusters as well or better than the currently available best performing clustering algorithms.

□ scSplit: Genotype-free demultiplexing of pooled single-cell RNA-seq:
>> https://www.biorxiv.org/content/biorxiv/early/2019/03/07/570614.full.pdf
scSplit uses a hidden state model approach to demultiplex individual samples from mixed scRNA-seq data with high accuracy. This approach does not require genotype information from the indi- vidual samples prior to demultiplexing which also makes it suitable for applications where genotypes are unavailable or difficult to obtain.

□ MultiCapsNet: a interpretable deep learning classifier integrate data from multiple sources:
>> https://www.biorxiv.org/content/biorxiv/early/2019/03/07/570507.full.pdf
The single cell RNA sequence data are decoupled into multiple parts according to the structure of MultiCapsNet model that has been integrated with prior knowledge, with each part represents genes influenced by a transcription factor or involved in a protein-protein interaction network and then could be viewed as a data source.
□ Automated exploration of Gene Ontology term and pathway networks with ClueGO-REST:
>> https://academic.oup.com/bioinformatics/advance-article/doi/10.1093/bioinformatics/btz163/5371065
□ A Gaussian process model and Bayesian variable selection for mapping function-valued quantitative traits with incomplete phenotypic data:
>> https://academic.oup.com/bioinformatics/advance-article/doi/10.1093/bioinformatics/btz164/5372341
the GP regression model for analyzing function-valued QTL data, the Bayesian forward selection approach to select the most important markers and the maximum a posterior (MAP) estimate for the hyper-parameters.
The method utilizes approximate Bayesian model posteriors and a stepwise variable selection procedure to efficiently search the model space and find the best subset of molecular markers to be included in the model. This method is non-parametric, includes a minimal number of tuning parameters, and can be applied efficiently to high resolution dynamic data with hundreds of time points.
□ GraphAligner: Bit-parallel sequence-to-graph alignment:
>> https://academic.oup.com/bioinformatics/advance-article/doi/10.1093/bioinformatics/btz162/5372677
Dynamic programming matrix for aligning the two linear sequence-to-sequence algorithms to graphs: the Shift-And algorithm for exact matching and Myers’ bitvector algorithm for semi-global alignment. For a graph with |V | nodes and |E| edges and a sequence of length m, the bitvector-based graph alignment algorithm reaches a worst case runtime of O(|V | + [m/w] |E| log w) for acyclic graphs and O(|V | + m|E| log w) for w arbitrary cyclic graphs.

□ Simplifying Genomics Pipelines at Scale with Databricks Delta:
>> https://databricks.com/blog/2019/03/07/simplifying-genomics-pipelines-at-scale-with-databricks-delta.html
The UAP4G architecture offers flexibility, allowing customers to plug in their own pipelines and develop their own tertiary analytics at petabyte-scale.

□ A Bayesian framework for inferring the influence of sequence context on single base modifications:
>> https://www.biorxiv.org/content/biorxiv/early/2019/03/09/571646.full.pdf
a statistical model that allows for the detection and evaluation of the effects of different sequence contexts on mutation rates from deep population sequencing data. the novel Bayesian method based on sparse model selection methods, with the leading assumption that the number of actual sequence contexts that directly influence mutation rates is minuscule compared to the number of possible sequence contexts.

□ ExpansionHunter: A sequence-graph based tool to analyze variation in short tandem repeat regions:
>> https://www.biorxiv.org/content/biorxiv/early/2019/03/09/572545.full.pdf
ExpansionHunter uses a novel computational method for genotyping repeats using sequence graphs. This method addresses the long-standing need to accurately genotype medically important loci containing repeats adjacent to other variants or imperfect DNA repeats. ExpansionHunter translates each regular expression into a sequence graph. Informally, a sequence graph consists of nodes that correspond to sequences and directed edges that define how these sequences can be connected together to assemble different alleles.
□ Infinite-dimensional Polish groups and Property (T):
>> https://arxiv.org/pdf/1903.00203v1.pdf
The proof is model-theoretic and does not rely on results of classification of unitary representations. Its main ingredient is the construction, for any א0-categorical metric structure, of a free group on a system of elementary substructures with suitable independence conditions. The theory of the resulting structure is א0-categorical: there is only one separable, infinite-dimensional, complex Hilbert space.
The same applies to the infinite symmetric group, S∞, and to the infinite-dimensional general linear group over the finite field with q elements, GL(∞,Fq).
□ Toward perfect reads: short reads correction via mapping on compacted de Bruijn graphs:
>> https://www.biorxiv.org/content/biorxiv/early/2019/02/28/558395.full.pdf
Bcool constructs a compacted de Bruijn graph from the reads. This graph is filtered on the basis of k-mer abundance then of unitig abundance, thereby removing most sequencing errors. The cleaned graph is then used as a reference on which the reads are mapped to correct them. this approach yields more accurate reads than k-mer-spectrum correctors while being scalable to human-size genomic datasets and beyond.
□ Lightweight merging of compressed indices based on BWT variants:
>> https://arxiv.org/pdf/1903.01465.pdf
a flexible and lightweight technique for merging compressed indices based on variants of Burrows-Wheeler transform (BWT), thus addressing the need for algorithms that compute compressed indices over large collections using a limited amount of working memory. Starting with a known lightweight algorithm for merging BWTs, they show how to modify it in order to merge, or compute from scratch, also the Longest Common Prefix (LCP) array. and currently working on an improved de Bruijn graph merging algorithm that also supports the construction of succinct Variable Order de Bruijn graph representations.
□ A comprehensive examination of Nanopore native RNA sequencing for characterization of complex transcriptomes:
>> https://www.biorxiv.org/content/biorxiv/early/2019/03/11/574525.full.pdf
a detailed evaluation of reads from Nanopore native RNA sequencing as well as complementary direct cDNA sequencing, from the perspective of transcript identification and quantification. They undertook extensive native RNA sequencing of polyA+ RNA from two human cell lines, and thereby analysed ~5.2 million aligned native RNA reads which consisted of a total of ~4.6 billion bases.
□ Taiyaki: Training models for basecalling Oxford Nanopore reads
>> https://github.com/nanoporetech/taiyaki
Taiyaki is research software for training models for basecalling Oxford Nanopore reads. Oxford Nanopore's devices measure the flow of ions through a nanopore, and detect changes in that flow as molecules pass through the pore. These signals can be highly complex and exhibit long-range dependencies, much like spoken or written language. Taiyaki can be used to train neural networks to understand the complex signal from a nanopore device, using techniques inspired by state-of-the-art language processing.
Taiyaki is used to train the models used to basecall DNA and RNA found in Oxford Nanopore's Guppy basecaller. This includes the flip-flop models, which are trained using a technique inspired by Connectionist Temporal Classification.

□ Deep Learning on Chaos Game Representation for Proteins:
>> https://www.biorxiv.org/content/biorxiv/early/2019/03/12/575324.full.pdf
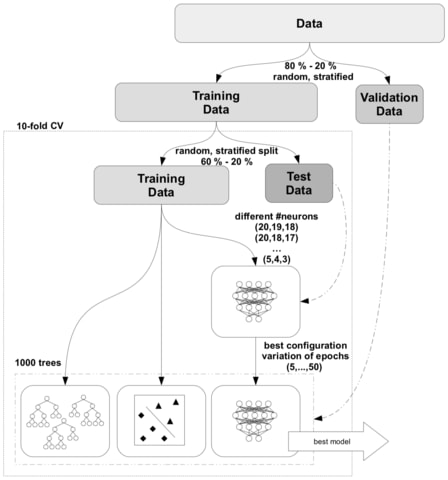
comparing the performance of SVMs, RFs, and DNNs, trained on Frequency matrix Chaos Game Representation (FCGR) encoded protein sequences. While the original chaos game representation (CGR) has been used mainly for genome sequence encoding and classification, they modified it to work also for protein sequences, resulting in n-flakes representation, an image with several icosagons.

□ MALVA: genotyping by Mapping-free ALlele detection of known VAriants:
>> https://www.biorxiv.org/content/biorxiv/early/2019/03/12/575126.full.pdf
MALVA computes the set of signatures of length ks of all the alternate alleles of all the variants in VCF and stores them in the set ALTSIG. In the same step, the signatures of the reference alleles are computed and stored in a second set named REFSIG. if a ks-mer of a signature of an alternate allele appears somewhere in the reference genome, MALVA extracts the context of length kc (with kc > ks) covering the reference genome region and collects such kc-mers in a third set (REPCTX).

□ New ‘R10’ nanopore released into early access
>> http://nanoporetech.com/about-us/news/new-r10-nanopore-released-early-access

□ bigSCale: an analytical framework for big-scale single-cell data
>> https://genome.cshlp.org/content/28/6/878.full
bigSCale, provides a scalable analytical framework to analyze millions of cells, which addresses the challenges associated with large data sets.
A directed convolution strategy allows processing of extremely large data sets, while preserving transcript information from individual cells.
□ Probabilistic Count Matrix Factorization for Single Cell Expression Data Analysis
>> https://academic.oup.com/bioinformatics/advance-article-abstract/doi/10.1093/bioinformatics/btz177/5378703
a probabilistic Count Matrix Factorization (pCMF) approach for single-cell expression data analysis, that relies on a sparse Gamma-Poisson factor model.
Thiis method is competed against other standard representation methods like t-SNE, and we illustrate its performance for the representation of single-cell expression (scRNA-seq) data.
□ Featherweight long read alignment using partitioned reference indexes
>> https://www.nature.com/articles/s41598-019-40739-8
Missing mappings refer to primary mappings that were not observed in empirical alignments, but were observed in alignments with reference parameters.
incorporated multi-index merging into the Minimap2 aligner and demonstrate that long read alignment to the human genome can be performed on a system with 2 GB RAM with negligible impact on accuracy.
Minimap2 stands out as the current aligner of choice for long reads, among other long read aligners such as BLASR, GraphMap, Kart, NGMLR and LAMSA; not only is it 30 times faster than existing long read aligners, but its accuracy is on par or superior to other algorithms.
The hash table based approach in Minimap2 has been shown to be effective for long reads. In contrast, FM-index based short read aligners such as BWA and Bowtie have been shown to fail with ultra long reads.
□ SMAUG: Analyzing single-molecule tracks with nonparametric Bayesian statistics
>> https://www.biorxiv.org/content/biorxiv/early/2019/03/14/578567.full.pdf
SMAUG provides a mathematically rigorous approach to measuring the real-time dynamics of molecular interactions in living cells.
a new approach to analyzing single-molecule trajectories: the Single-Molecule Analysis by Unsupervised Gibbs sampling (SMAUG) algorithm, which uses nonparametric Bayesian statistics to uncover the whole range of information contained within a single-particle trajectory (SPT) dataset.

□ Physicists reverse time using quantum computer
>> https://www.eurekalert.org/pub_releases/2019-03/miop-prt031119.php
https://www.eurekalert.org/pub_releases/2019-03/miop-prt031119.php
the violation of the second law via a device called a Maxwell's demon," Lesovik said. "The most recent paper approaches the same problem from a third angle: artificially created a state that evolves in a direction opposite to that of the thermodynamic arrow of time."


□ gnomAD-SV: An open resource of structural variation for medical and population genetics
>> https://www.biorxiv.org/content/biorxiv/early/2019/03/14/578674.full.pdf
gnomAD-SV, a reference atlas of SVs from deep WGS in ~15,000 samples aggregated as part of gnomAD. A rich landscape of 498,257 unique SVs, including 5,729 multi-breakpoint complex SVs across 13 mutational subclasses, and examples of localized chromosome shattering, like chromothripsis, in the general population.
And calculate that 87% of SVs across all populations were in Hardy-Weinberg Equilibrium, although this is an imperfect metric given the potential confounding assumptions and population genetic forces that may not hold true for all SV sites.
□ Sci-Hi-C: a single-cell Hi-C method for mapping 3D genome organization in large number of single cells
>> https://www.biorxiv.org/content/biorxiv/early/2019/03/15/579573.full.pdf
by combining HiCRep with multidimensional scaling (MDS), we was able to implement an analytical tool to embed sci-Hi-C data into a low- dimensional space, which successfully separate cell subtypes from a cell population based on cell-to-cell variations in cell-cycle phase.
□ Matrix factorization for multivariate time series analysis
>> https://arxiv.org/pdf/1903.05589v1.pdf
the factorization provides a decomposition of each series in a dictionary which member that can be interpreted as latent factors used for example in state-space models.
Estimation by empirical risk minimization. By multiplying both sides by the pseudo-inverse Λ+ = Λ∗(ΛΛ∗)−1, we obtain the “simplified model”
The rows of ε are independent and have the same T-dimensional are derived. sub-Gaussian distribution, with second moment matrix Σε.
□ HiLDA: a statistical approach to investigate differences in mutational signatures
>> https://www.biorxiv.org/content/biorxiv/early/2019/03/15/577452.full.pdf
a hierarchical latent Dirichlet allocation model (HiLDA) for characterizing somatic mutation data that allows the user to simultaneously extract mutational signatures and infer mutational exposures between two different groups of mutational catalogs.
HiLDA provides posterior distributions for each parameter, thereby allowing construction of 95% credible intervals for parameters.

□ Primo: integration of multiple GWAS and omics QTL summary statistics for elucidation of molecular mechanisms of trait-associated SNPs and detection of pleiotropy in complex traits
>> https://www.biorxiv.org/content/biorxiv/early/2019/03/16/579581.full.pdf
Primo identifies SNPs in various association patterns to complex and omics traits and performs conditional association analysis in a region to account for linkage disequilibrium.
the conditional association analysis of Primo examines the conditional associations of a SNP with multiple traits adjusting for other lead SNPs in a gene region. It moves beyond joint association towards causation and colocalization, and provides a thorough inspection of the effects of multiple SNPs within a region to reduce spurious associations due to LD.