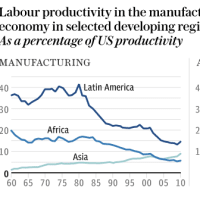
This is the most important chart in the world right now
(これこそ今世界で一番重要なチャートなのだ)
By Ben Wright, and Peter Spence
Telegraph: 4:06PM BST 13 Oct 2014


(これこそ今世界で一番重要なチャートなのだ)
By Ben Wright, and Peter Spence
Telegraph: 4:06PM BST 13 Oct 2014
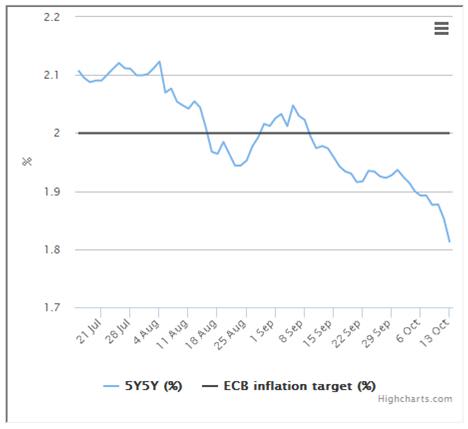
The European Central Bank's key indicator of medium-term inflation expectations is "flashing red". The markets are watching to see what happens next
ECBの主要指標、中期インフレ期待が「赤信号点滅」。市場は何が起こるのか注目中。
European stock markets fell to a 12-month low on Friday. At least part of the reason for the sell-off was the chart below. Andrew Roberts, the co-head of European economics and rates research at the Royal Bank of Scotland, has described it as "the most important market signal on the planet right now".
金曜日、欧州市場が12ヶ月ぶり最安まで値下がりしました。
セルオフの原因の少なくとも一部は下のチャートです。
RBSのロバーツ氏はこれを「今地球上で最も重要なマーケットシグナル」と評しました。
He added: "Everybody is watching the chart, and it has just gone off a cliff."
「みんなこのチャートを見てる。それがガクッと逝ったわけだ」
So what does it show and why is it so important?
このチャートは何を示していて、何がそんなに重要なのでしょうか?
To answer that question, we need to work backwards.
その答えを知るには、さかのぼって考える必要があります。
The biggest threat to the world economy, according to George Osborne among many others, is a slowdown in the eurozone. And arguably the biggest threat to the eurozone is deflation.
オズボーン財務相その他大勢曰く、世界経済にとって最大の脅威はユーロ圏の減速だそうです。
そしてユーロ圏にとって最大の脅威がデフレであることは間違いありません。
Deflation is a decrease in the general price level of goods and services. That sounds like a good thing. But it's bad news for heavily indebted economies (like most of those in the eurozone) because it effectively increases the real value of the money that they owe – it makes their debts bigger. Deflation combined with low economic growth is a particularly nasty combination.
デフレとは製品やサービスが全体的に値下がりすることです。
良いことのように聞こえます。
しかし、(ほとんどのユーロ加盟国のような)重債務国にとっては悪い報せです。
というのも、これは事実上、これらの国が借りているお金の実質的価値を増大させる、つまり借金を膨らませるからです。
デフレと低成長の組み合わせは特に危険です。
That's why the European Central Bank keeps a close eye on inflation expectations. It likes to see inflation running at around 2pc – not too high and not too low. In August, Mario Draghi, the ECB's president, said that his preferred measure of medium-term inflation expectations was the 5y forward swap rate.
だからこそ、ECBはインフレ期待に注目し続けているのです。
インフレ率が約2%と高過ぎず低過ぎない水準に落ち着いてほしいと思っています。
ドラギ総裁は8月に、自分は5年物スワップレートを中期インフレ期待の指標にしていると言いました。
That sounds tremendously geeky. And, in some ways, it is (there's a fuller explanation here). But for the purposes of this explanation it's enough to know that it measures the market's expectation of what inflation will be starting in five years time and ending in 10 years time (for the five years starting in five years time) – in other words, the medium term.
これは極めてオタクっぽい響きです。
しかも或る意味オタクなのです(解説はこちら)。
とはいえ、一応説明致しますと、これは市場の5年後から10年後までの(5年間の)インフレ期待を、要するに中期のインフレ期待を測定しているのです。
As Ambrose Evans-Pritchard wrote on Friday, "Mario Draghi, the ECB's president, has adopted the 5Y/5Y rate as the bank's policy lodestar, used to distill expectations of future inflation".
AEPが金曜日に書いていたように、「マリオ・ドラギECB総裁は将来のインフレ期待を察知するために用いるECBの政策を導く星として5Y/5Y金利を採用しました」。
And the key number on the chart is 2pc. Any fall below this level is a "flashing red light".
そして、このチャートの重要な数字は2%です。
これ以下は「赤信号点滅」なのです。
On Friday it hit 1.77pc.
金曜日は1.77%まで下落しました。
This increases the likelihood of two things. First, that the eurozone is heading towards a Japanese-style deflationary trap. And, second, that the ECB will engage in full-blown quantitative easing to ward off such an unappealing prospect.
これは2つの可能性を高めています。
一つ目の可能性は、ユーロ圏が日本式のデフレ・トラップに突き進んでいるかもしれないということです。
そして二つ目の可能性は、ECBがそのような好ましくない可能性を阻止するために本格的な量的緩和策に乗り出すかもしれないということです。
The markets are terrified of the first possibility and hopeful of the second. Hence, why all eyes are on the chart: the lower it falls, the more likely it is that Mr Draghi will have to act.
市場は第1の可能性に恐れ戦き、第2の可能性にときめいています。
ということで、皆、このチャートに注目しているのです。
下落すれば下落するほど、ドラギ総裁が行動しなければならなくなる可能性は高まります。