日米とも失業者の増加ペースが加速している。米週刊失業保険の継続受給者が過去最高となった。全雇用者に占める比率でいうと(※1の下のグラフ)、まだ70年代、80年代の方が高いが90年初頭の水準は超えている。
日本も12月の失業率、0.5ポイント上昇で、67年と並ぶ過去最大の悪化幅となったようだ(※2 過去3か月の失業率 10月 3.7%→11月 3.9% →12月 4.4%)。
月間の失業者の増加数が39万人と人口比でいえばアメリカ並みのペースといえる。
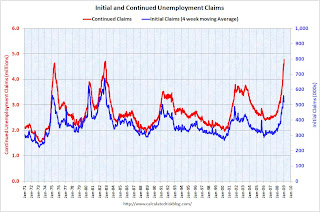
※1 Continued Unemployment Claims at Record High
http://www.calculatedriskblog.com/2009/01/continued-unemployment-claims-at-record.html
・・・・・
 Click on graph for larger image in new window.
The first graph shows weekly claims and continued claims since 1971.
The four week moving average is at 542,500; still below the recent peak of 558,750
in December.
Continued claims are now at 4.78 million - a new record - just above the previous all time peak of 4.71 million in 1982.
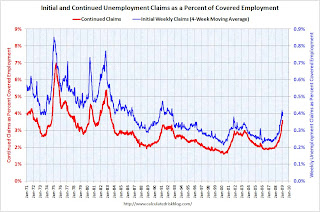 The second graph shows the 4-week average of initial weekly unemployment claims (blue, right scale), and total insured unemployed (red, left scale), both as a percent of covered employment.
※2 12月の失業率、0.5ポイント上昇 67年と並ぶ過去最大の悪化幅
http://www.nikkei.co.jp/news/main/20090130AT3S3000S30012009.html
世界的な景気後退で、国内の生産活動や雇用情勢の悪化が加速している。総務省が30日発表した2008年12月の完全失業率は4.4%と前月に比べて0.5ポイント悪化、41年ぶりの大幅な悪化幅となった。・・・・・
自己都合による求職が5万人増だったのに対し、企業の倒産などによる「勤め先都合の求職」が25万人増えた。完全失業者は前年同月に比べて39万人増え、270万人となった。


