一緒に世界の将来について考えよう

世界の将来について、一緒に考えていくブログ
-2006年から大恐慌の到来を予想
-6年半ぶりに投稿

大恐慌!?その443 個人消費抜きの業績回復

2009-07-29 08:49:06 | 世界経済

さて、7月米消費者信頼感指数は予想以上に低下したという。景気回復ストーリーの中心である個人消費は、政府支援策でかろうじて支えられている状況がこの時点でも変わっていないとすると、今後支援策後の息切れが、ますます懸念される事態となりつつある。

私の勝手な推測としては、これまで以上に企業に短期的成果が求められる中、売上が伸びなくても企業はコスト削減で想定以上の利益を確保した。短期的に最もコスト削減をもたらすのは、雇用削減、調整である。徹底的な雇用削減は、想定以上の雇用減と想定以上の利益をもたらした。そして、個々の企業の業績向上と、経済全体としても個人消費の伸び悩みをもたらしている。本来、業績向上による株価上昇が、個人消費にもプラスの効果をもたらすという好循環に入る段階のはずであるが、マイナス要因との綱引きで厳しい局面となる懸念も出ている状況であろう。


※ 7月米消費者信頼感指数は予想以上に低下

http://jp.reuters.com/article/topNews/idJPJAPAN-10259020090728

米大手民間調査機関のコンファレンス・ボード(CB)が発表した7月の消費者信頼感指数は46.6と前月の49.3から低下した。

 労働市場の厳しい状況が消費者心理を引き続き圧迫するなか、2カ月連続で低下した。

 アナリスト64人を対象に実施したロイター調査の予想中央値は49.0だった。


大恐慌!?その442 ケース・シラー指数 季節変動に注意

2009-07-29 08:42:28 | 世界経済

ケースシラー米住宅価格指数前月比上昇、というヘッドラインが踊っている様だが、米国時間朝の指数の発表が季節調整前の数字だけで、季節調整後の数字は後から発表されたため、勘違いの記事が出回っている様だ(※1)。季節調整後の数字は減少(※2)。

なお、※2の図はぜひ拡大してみて頂きたいが、青が季節調整前(Not seasonally adjusted)、赤点線が季節調整後(Seasonally adjusted)である。

グラフを見れば明らかなように、90年代は季節調整でスムーズなトレンドを示していた(赤のラインがスムーズだった)が、直近は季節調整が不十分なため、季節調整後でも、大幅な季節変動が残ってしまっている(特に08年を見て頂きたい)。

ということで、前月比で上昇、というのは季節調整前だけを見ての話、季節調整後で考えても、季節変動が十分取り除かれていない、ということで、秋以降再び下落を加速するというのが、最もありうるシナリオである。ということで、指数の解釈は慎重に。


※1 ケースシラー米住宅価格指数前月比上昇:識者はこうみる

http://jp.reuters.com/article/mostViewedNews/idJPJAPAN-10258820090728


※2 Case-Shiller House Price Seasonal Adjustment and Comparison to Stress Tests

http://www.calculatedriskblog.com/2009/07/case-shiller-house-price-seasonal.html

・・・Case-Shiller reported that prices fell at a 2.5% annual rate in May (SA).・・・


The following graph shows the month-to-month change of the Case-Shiller index for both the NSA and SA data (annualized). Note that Case-Shiller uses a three-month moving average to smooth the data.

Case-Shiller House Prices Seasonal Adjustment Click on graph for larger image in new window.

The Blue line is the NSA data. There is a clear seasonal pattern for house prices.

The red dashed line is the SA data as provided by Case-Shiller.

The seasonal adjustment appears pretty good in the '90s, but it appears insufficient now. I expect that the index will show steeper declines, especially starting in October and November.

(図の拡大:ぜひ見て頂きたい)

http://4.bp.blogspot.com/_pMscxxELHEg/Sm8Qy9GjzAI/AAAAAAAAF7s/deUYRxiFWDM/s1600-h/CaseShillerSeasonal.jpg


大恐慌!?その441 米不動産価格 CREの下落が急速にキャッチアップ中

2009-07-24 12:21:43 | 世界経済

個人用住宅価格(青)と商業用不動産(CRE)価格(赤)を比較した面白いグラフ。

これをみると、

・CREの価格下落は、個人向けより遅くスタート

・いったん落ち始めると、下落ペースは速い

ということがわかる。

会計基準の変更で、最近の価値下落分のそれなりの部分は金融機関の

バランスシートに封印された形になっていると想像されるが、

今後の展開が要注目である。


Real Estate: Commercial and Residential Prices

http://www.calculatedriskblog.com/2009/07/real-estate-commercial-and-residential.html


CRE and Residential Price indexes Click on graph for larger image in new window.


大恐慌!?その440 米住宅着工件数は底入れ感あり--価格の底はまだ

2009-07-24 12:14:20 | 世界経済

タイムラグが出来ており、先週のニュースですが。

----------------------------

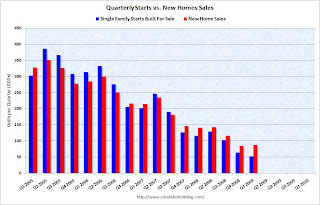
6月の米住宅着工件数は+3.6%となり、一戸建て住宅着工件数が押し上げたという。※2に詳しい分析があるが、着工件数統計の中の"Single Family Starts, Built for Sale")は過去6か月新築戸建住宅販売数を下回っており、着工件数としては本格的に底入れした可能性がある。

ただ、以前から何度も言っている様に、価格的にはまだ高く、市場に巨大な在庫が残っている現状では、早急な価格面での底入れは望めない。価格面での底入れまでは、資産価値へのマイナスの影響は残る。


といっても、住宅着工件数の底入れには良い面もある。

GDPに占める住宅投資("Residential Investment")の割合は、2006~2007年ごろのピーク3.5%超から、直近で0.8%まで落ちている(※2の2つ目のグラフ)。過去50年の平均が2.35%と考えると流石に落ちすぎであり、 いずれ回復が始まるのは自然なことだろう。

これまで大幅減でGDPにネガティブインパクトを与え続けていたことを考えると、ポジティブニュースではあるが、GDPの7割を占める個人消費に大きな影響を与える住宅価格の動向に比べると、インパクトは微々たるもの、というのが真相であろう。


※1 UPDATE1: 6月の米住宅着工件数は+3.6%、一戸建て住宅着工件数が押し上げ

http://jp.reuters.com/article/marketsNews/idJPnJT843397220090717


※2 Housing Starts: A Little Bit of Good News

http://www.calculatedriskblog.com/2009/07/housing-starts-little-bit-of-good-news.html

青("Single Family Starts, Built for Sale")は過去6か月赤の戸建住宅販売数を下回る。
Housing Starts Click on graph for larger image in new window.

This graph provides a quarterly comparison of housing starts and new home sales. In 2005, and most of 2006, starts were higher than sales, and inventories of new homes rose sharply. For the last six quarters, starts have been below sales – and new home inventories have been falling.

・・・・
Residential Investment Single Family Structures 
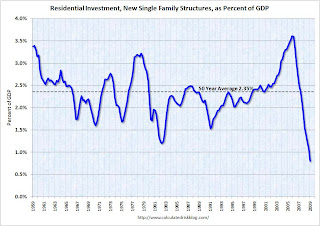
As everyone knows, investment in single family structures has fallen off a cliff. This is the component of RI that gets all the media attention - although usually from stories about single family starts and new home sales.

In Q1, investment in single family structures was at 0.8% of GDP, significantly below the average of the last 50 years of 2.35% - and also below the previous record low in 1982 of 1.20%.


大恐慌!?その439 W型不況

2009-07-23 01:47:20 | 世界経済

さすがにレイアウト変更だけだとひどいと思うので、夜遅いですが、簡単に。

-------------------

W型不況については、Roubini教授の説を何度か紹介している。すなわち、年内は不況が続き、2010年初頭から回復するものの、来年後半に再び不況に陥る可能性があるという説。

今回は、Harvard大学のFeldstein教授のW型不況説(※1)。こちらは3QにいったんGDPは横ばいないしプラス成長に転じるものの、4Qには再びマイナス成長に戻るという。現在、企業は一旦絞った在庫を再び増やすフェーズに入っているが、最終需要が伸びないため、在庫積み増しが止まること、政府刺激策の効果が切れること、を要因とみている。

なお、足元の景気回復はマクロでは弱い。※2のフィラデルフィア連銀の景気一致指数は6月も若干の回復を示した程度。※3の建築士請求指数は、商業用不動産(CRE)に確か9~12か月程度先行するとされており、来年になってもCRE市場が回復に向かわないことがうかがわれる。


※1 Feldstein: Risk of Double Dip

http://www.calculatedriskblog.com/2009/07/feldstein-risk-double-dip.html

・・・The economy could “flatten out” or “even be positive” in the third quarter, and then it’s likely to contract again in the last three months of the year as the effects of the federal stimulus program wear off and companies finish rebuilding inventories, he said.

“There isn’t going to be enough to sustain a really solid recovery,” he said, even though recent data has provided some “good news” on the economy. ・・・


※2 Philly Fed State Coincident Indicators: Widespread Recession in June

http://www.calculatedriskblog.com/2009/07/philly-fed-state-coincident-indicators.html

Philly Fed Number of States with Increasing ActivityThe second graph is of the monthly Philly Fed data of the number of states with one month increasing activity. Most of the U.S. was has been in recession since December 2007 based on this indicator.


※3 

AIA: Architecture Billings Index Declines in June

http://www.calculatedriskblog.com/2009/07/aia-architecture-billings-index.html

AIA Architecture Billing Index Click on graph for larger image in new window.