統計技術 第Ⅲ部:第2章 多変量記述統計(6)
第2章-4:Multivariate Descriptive Statistics (続き)
● Free Statistics Software (Calculator) - Web-enabled scientific services & applications
https://www.wessa.net
(2) Notched Boxplots
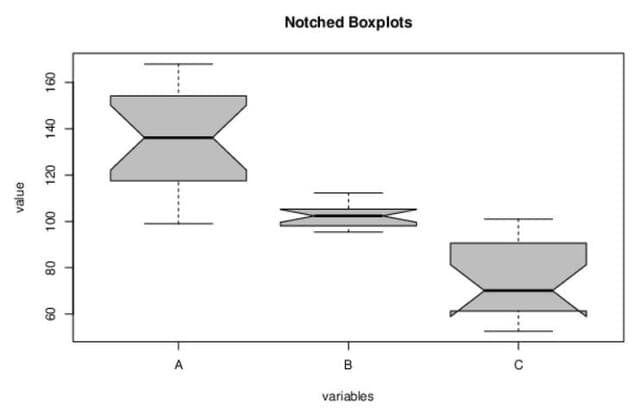
一般的なBoxplots(箱ひげ図)の変形であり、四分位数の数値で標本の広がりや歪度をグラフィカルに示したものである.
ノッチ(Notch)とは、中央値からの95%信頼区間(95%CI)を箱の切れ目(ノッチ)で示しており、例えば、2群のNotchが重ならないなら統計的に有意(p<0.05)と判断される.
それでは、例題を実行してNotched Boxplotsをみてみよう.
「Wessa.net」のTop ページから、
Descritive Statistisc を選択
↓
下方にスクロースして、
Multivariate Descriptive Statistics
↓
既存のデータ
↓
Compute をクリック
図1 Boxplot statics
lower(upper) whisker, hinge, median の統計量表示.
図2 Boxplot Nitches
lower(upper) bound, median の統計量表示
図3 Notched Boxplots
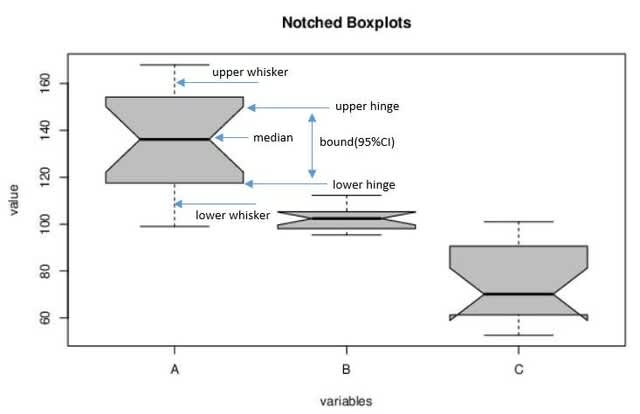
図4 Notched Boxplots (whisker, hinge, median, bound) の説明
ここで、
図1の統計量をまとめると次のようになる.
....Variable.....lower/upper whisker.....lower/upper hinge.....median
........A...................99/168..................117.6/154.2.........136.2
........B................95.4/112.3................98.1/105.3...........102.4
........C................52.6/101...................61.3/90.6..............70.1
....Variable.....lower/upper bound
........A................122.17
........B..................99.64
........C..................58.72
なお、
lower/upper whisker は 最小値/最大値又は%tile内の値を用いることが多い.
lower/upper hinge は 25%/75% tile(3rd quartile)に一致することが多い.
lower/upper bound は median±1.58*IQR/√n
IQR=upper hinge (75%tile)- lower hinge (25%tile)


