「FrequenciesのBayesian Log-linear Regression」について、簡単にその方法をご紹介しておきましょう。
「Log-linear Regression」(ログリニア回帰分析)は、分割表の度数を対数変換し1次式のモデルから、各度数の影響を見るもので、各属性の主効果およびそれらの交互作用で説明するモデリング法であり、一般の回帰分析や分散分析と似ています。
なお、交互作用がない対数線形モデルを独立モデル(加法モデル)、交互作用を含めたモデルを飽和モデルと言います。
なお、交互作用がない対数線形モデルを独立モデル(加法モデル)、交互作用を含めたモデルを飽和モデルと言います。
試してみましょう。
JASPを立ち上げたなら、
File→[ Data Library ] をクリック → 5.Frequencies→Death Penalty→ダブルクリック
File→[ Data Library ] をクリック → 5.Frequencies→Death Penalty→ダブルクリック
・・とすれば、下記の結果を見ることが出来ます。
***
Death Penalty: Bayesian Log-linear Regression
***
Death Penalty: Bayesian Log-linear Regression
Description:
This data set, "Death Penalty", provides court decisions on a death penalty (i.e., yes or no) split by race of a defendant (i.e., White or Black) and
race of the victim (i.e., White or Black).
This data set, "Death Penalty", provides court decisions on a death penalty (i.e., yes or no) split by race of a defendant (i.e., White or Black) and
race of the victim (i.e., White or Black).
Variables:
•RaceVictim - Race of the victim (white, black). :被害者の人種
•RaceDefendant - Race of the defendant (white, black). :被告の人種
•Count - The number of trials belonging to the combination of the categories. :件数
•Death - The court decision on the death penalty (yes = death penalty, no = no deatch penalty). :判決
***
チョットややこしいと思われるなら、
前回の「新・医学と統計(18)」での例題(Frequency.csv)を用い、次の要領でやってみて下さい。
前回の「新・医学と統計(18)」での例題(Frequency.csv)を用い、次の要領でやってみて下さい。
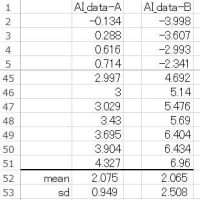
File→Frequency.csv(図1)
図1 Frequency.csv

↓
Frequencies→「Bayesian Log-linear Regression」
↓
Countの変数名をScaleに変更
↓
Counts(optional):Count
Factor:Gender、TC
↓
図2 出力結果(1)
Frequencies→「Bayesian Log-linear Regression」
↓
Countの変数名をScaleに変更
↓
Counts(optional):Count
Factor:Gender、TC
↓
図2 出力結果(1)

デフォルトでは、最良のモデルのみを表示しており、ベイズ因子の最もパフォーマンスの高いモデルは「1」のBFとなります。
***
ここで、通常の対数線形モデルは、
Frequencies→「Log-linear Regression」で求められます。
Frequencies→「Log-linear Regression」で求められます。
実行結果のみを表示すると図3 のようになります。
図3 出力結果(2)

図3 の結果を見るとEstimate(係数)の p値は<0.05ですが、ただし対数線形モデルでは残差を確認する必要があります。
Deviance と Redisual Devience を見ると Gender や TC 単独では当てはめが悪いことが分かります。
Deviance と Redisual Devience を見ると Gender や TC 単独では当てはめが悪いことが分かります。
次回は、
このモデルに当てはめた時の予測をデータ解析環境「R」でやってみましょう。
このモデルに当てはめた時の予測をデータ解析環境「R」でやってみましょう。
次回に続く!
情報統計研究所をご気軽にご利用くださいませ。


