


以前 R で書いた高度角を計算してくれるコードを少し改良して
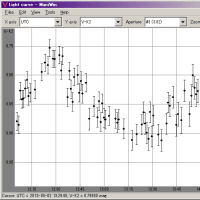
美星天文台の ELPlot みたいに グラフ化までしてくれるようにしました。 
今はまだ1天体しかプロットできないです。
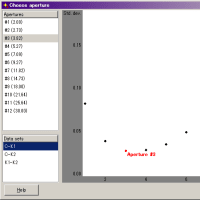
ELPlot のようにα, δが記載された天体リストから
任意で複数の天体をプロットできればさらに使い勝手がよくなるでしょうか。
以下コードをメモ:
======
    star<- "possible nova Sgr 2012"
    ra  <- "17 45 28"      # R.A.
    dec <- "-23 05 21"     # Dec.
    std <- 20120421        # 年月日

    la  <- 8.928719815   # [hour] 東経・観測地
    phi <- 34.6938888    # [deg] 緯度・観測地
    time <- seq(17,31, by=0.1)

    #------RA と Dec を deg へ変換
    ra_s   <- as.integer(substr(ra,7,8)) / 60
    ra_m   <- (as.integer(substr(ra,4,5)) + ra_s) / 60
    ra     <- (as.integer(substr(ra,1,2)) + ra_m) *15
    dec_s  <- as.integer(substr(dec,8,9))/ 60
    dec_m  <- (as.integer(substr(dec,5,6)) + dec_s) / 60
    dec_d  <- as.integer(substr(dec,2,3)) + dec_m
     pm<-substr(dec,1,1)
     if (pm=="-") {dec<-dec_d*-1}else{dec<-dec_d}

    #------グリニッジ平均恒星時の計算
     y <- substr(std, 1, 4)
       Y <- as.integer(y) - 1900
     m <- substr(std, 5, 6)
       M <- as.integer(m)
     d <- substr(std, 7, 8)
       d <- as.integer(d)

    k <- 365*Y + 30*M + (d-33.5)
    g <- as.integer(0.6*(M+1)) + as.integer(Y/4)
    K <- k+g

    Tu <- K/36525
    Tu2 <- Tu^2
    a <- 8640184.542*Tu
    b <- 0.0929*Tu2

    ze <- 23925.836 + a + +b
      z1 <- ze / 60 / 60 / 24
      zz <- as.integer(z1)
    z0 <- (z1 - zz) * 24   # [hour] グリニッジ平均恒星時

    #-----恒星時の計算
    h9 <- time
    h  <- h9 - 9
    ti <- h

    cor <- ti * 0.00273791
    th <- z0 + la + ti + cor
    th <- ifelse(th < 24, th, th <- th - 24) #恒星時[hour]

    #------高度角の計算
    th <- th * 15
    sinh <- sin(phi*pi/180)*sin(dec*pi/180)+cos(phi*pi/
                180)*cos(dec*pi/180)*cos((th-ra)*pi/180)
    h <- asin(sinh) * 180/pi # [deg]

    #------プロット
    par(lwd=2,ps=13,tcl=0.4)
    plot(time,h,type="l",ylab="Elevation",ylim=c(0,90),
         axes=F,lab=c(10,10,10),
         xlab="Time (JST)",sub=std,main=star,col="white")
      box()

      gx <- seq(10,90,by=10)
      gy <- seq(17,31,by=1)
      abline(h=gx,col="gray",lty=2,lwd=1)
      abline(v=gy,col="gray",lty=2,lwd=1)
       axis(1, lwd.ticks=2)
       axis(2, lwd.ticks=2)
       axis(3, lwd.ticks=2, lab=F)
       axis(4, lwd.ticks=2, lab=F)

      lines(time,h,lwd=3,col="blue")


※コメント投稿者のブログIDはブログ作成者のみに通知されます