goo blog サービス終了のお知らせ 

ぴかりんの頭の中味

主に食べ歩きの記録。北海道室蘭市在住。

【論】Raychaudhuri,2001,Basic microarray analysis: ~

2007年02月10日 22時31分50秒 | 論文記録
Soumya Raychaudhuri, Patrick D.Sutphin, Jeffrey T.Chang, Russ B.Altman.
Basic microarray analysis: Grouping and feature reduction.
TRENDS in Biotechnology,19(5):189-193. 2001
[PDF]

・マイクロアレイデータ解析法の概論。クラス分けと遺伝子抽出について。
・データ:Lymphoma specimens, 47サンプル, 4026遺伝子 [Alizadeh]
・解析法
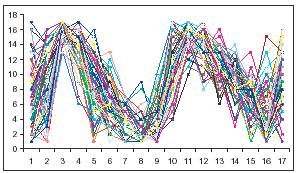
1.Unsupervised grouping : clustering → K-means clustering method with a Euclidean distance metric
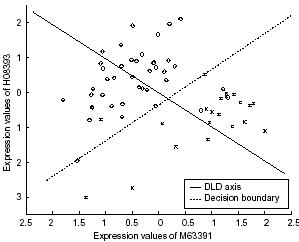
2.Supervised grouping : classification → Linear discriminant analysis that uses differential weights to specify the features
3.Unsupervised dimensional reduction : pruning uninformative features → PCA [図]
4.Supervised dimensional reduction : feature selection → Iterative LDA method
・使用ソフト:CLEAVER http://classify.stanford.edu/

・概要「We briefly review supervised and unsupervised methods for grouping and reducing data in the context of a publicity available suite of tools called CLEAVER, and illustrate their application on a representative data set collected to study lymphoma.
・「When grouping is supervised it is called 'classification' and when it is unsupervised it is 'clustering'.
・問題点「Unsupervised approaches can find novel profile groupings but are not designed to reliably produce groupings that are known from independent sources of information.
・問題点「Features are removed because they do not provide significant incremental information and because they can confuse the analysis or make it unnecessarily complex.
コメント
  • X
  • Facebookでシェアする
  • はてなブックマークに追加する
  • LINEでシェアする

【論】椎塚久雄,2006,感性システムのフレームワークと感性工学の展望

2007年02月07日 22時19分46秒 | 論文記録
椎塚久雄
感性システムのフレームワークと感性工学の展望
感性工学 Vol.6 No4 p.3-16, 2006
[Web Site]

・「人類に幸福をもたらす成熟した技術は横断型科学技術の中にあり、21世紀になって解決すべき問題は、従来の枠組みではとらえられない問題が山積しており、明らかに解くべき科学技術の問題が変わりつつある。その中で最も最重視されなければならないのは「感性」に着目した研究の中に見出すことが期待されている。
・「The word of Kansei engineering was used for the first time in America by Mazda motor company.
・「われわれが使っている「感性」という言葉の語源は、古くはアリストテレスの「アイステーシス」(aisthesis、 感性・感覚を意味する古代ギリシャ語)であり、同じく「Ethos」と近似した意味を持っていると考えられている。
・「感性工学は本来、感情(感性)と設計技術の認識の間の適切なバランスを扱う学問である。
・「最近ではファインダビリティ(findability)の概念が新たな問題として同時に注目を集めている[21]。
・「ユーザーエキスペリエンスとは、製品やサービスの使用・消費・所有などを通じて、人間が認知する(有意義な)体験のことであり、製品やサービスを利用する過程(の品質)を重視し、ユーザーが真にやりたいこと(本人が意識していない場合もある)を「楽しく」「面白く」「心地よく」行える点を、機能や結果、あるいは使いやすさとは別の "提供価値" として考えるコンセプトである。
・「現在、 "情報工学" と呼ばれる技術の大部分は "データ工学" にすぎないと言ってもよい。なぜならば、大部分はその保存、処理、移行等の技術であり、理解や情報の形成及び伝達を念頭に置いたものではないからである[24]。」 これまでの流れを根底から覆すような考え方。衝撃的。
・「一般的に、知識は暗黙知(tacit knowledge)と形式知(explicit knowledge)に分けられるが、人が持つ知識は暗黙知が中心になると言われている。
・「アフェクティブ・コンピューティング(affective computing)は感情(emotion)とコンピュータに関する問題を扱う比較的若い研究分野である[25]。
・「さらには、無制限の計算パワーとメモリを持つ現在のコンピュータが、ベストの状態でゴキブリの知的水準にあると言われているのも興味深い。
・「"感性" を世界に向けてひろめていくには、「Kansei」に代わる国際語を制定する必要にせまられている。世界に向けて発信する言葉として「Kansei」はもはや新鮮さ・瑞々しさを失っているように思われる[28]

・これからが期待される新しい分野。
~~~~~~~
・論文記録90本ということで、普段と毛色の違う分野の文献を。100本まであと少し。
コメント
  • X
  • Facebookでシェアする
  • はてなブックマークに追加する
  • LINEでシェアする

【論】Ge,2005,Interpreting expression profiles of ~

2007年02月04日 17時17分29秒 | 論文記録
Ge X, Yamamoto S, Tsutsumi S, Midorikawa Y, Ihara S, Wang SM, Aburatani H.
Interpreting expression profiles of cancers by genome-wide survey of breadth of expression in normal tissues.
Genomics. 2005 Aug;86(2):127-41.
[PDF][Web Site]

・ヒトの各組織のアレイデータについて、手持ちのデータに加え、過去研究のデータも網羅的に解析し、組織特異的遺伝子(tissue-specific genes)を抽出する。
・データ
1.(オリジナルデータ)Adult human tissues, 35サンプル(3 fetal/33 normal, すべて別な器官の組織), 約20000遺伝子 → Tissue-specific genes を1956個、Tissue-selective genes を920個抽出
2.(既存データ)Normal tissue (HuGe Index database), Normal tissue (Gene Expression Atlas database), Multiple cancer types [Su], Liver cancer [Midorikawa], Breast cancer [Perou], Breast cancer [Sorlie], Lung cancer [Bhattacharjee] 他
・遺伝子抽出法
1.Tissue-specific : t test and several empirical criteria(→謎)
2.Tissue-selective : Sprent's nonparametric method[19]
・遺伝子クラスタリング法 : Average linkage hierarchical clustering [Eisen]

・問題点「A critical difficult part of studying cancer with DNA microarrays is data interpretation.
・概要「In this paper, we performed additional microarray experiments of normal tissues to search extensively for tissue-specific genes and then systematically reanalyzed previously published DNA microarray data of various cancers.
・研究の意義「Knowing how genes are expressed under normal physiological conditions is important for dissecting complicated cancer transcriptomes.
・特異的遺伝子の定義「We consider a gene specific to a tissue type if it is exclusively highly expressed in this tissue.
コメント
  • X
  • Facebookでシェアする
  • はてなブックマークに追加する
  • LINEでシェアする

【論】Bo,2002,New feature subset selection procedu~

2007年01月30日 21時05分11秒 | 論文記録
Trond Hellem B? and Inge Jonassen
New feature subset selection procedures for classification of expression profiles
Genome Biology 2002, 3:research0017.1-0017.11
[PDF][Web Site]

・サンプルのクラス分けに使う遺伝子の抽出法の提案。サンプルを最もよく分離できる二つ一組(pair)の遺伝子を抽出(→繰り返す)。
・データ
1.Leukemia, 72 samples (ALL 47/ALL 25), 7129 genes [Golub]
2.Colon cancer, 62 samples (normal 22/tumor 40), 6500 genes [Alon]
・遺伝子ランキング法
1.Individual ranking (IR, 従来法)
2.Forward selection (FS, 従来法)
3.All pairs (AP, 提案法):全ての遺伝子について総あたりで計算
4.Greedy pairs (GP, 提案法):t-scoreでふるいにかけた遺伝子のみで計算、処理を高速化
・識別法(サンプルクラス分け)
1.Diagonal linear discriminant (DLD)
2.Fisher's linear discriminant (FLD)
3.k nearest neighbors (kNN)
・ソフトウェア:J-Express software packageで利用可能

・概要「Our results have implications for how to select marker genes and how many gene measurements are needed for diagnostic purposes.
・問題点「One problem with gene expression data is that each example has too many features, and many of them are noisy and irrelevant for the learning problem at hand.
・FSSとは「The problem of finding the best subset is commonly referred to as the feature subset selection (FSS) problem.
・方法「We give each pair of genes a score reflecting how well the pair in combination distinguishes two experiment classes.
・処理「We evaluate a gene pair by computing the projected coordinates of each experiment on the DLD axis using only these two genes. We then take the two sample t-statistic on the projected points as the pair socre.
・問題点「We do not claim that our pair-based methods will find all interesting genes, as there may be relevant genes that are significant by themselves but may not appear in any of the high-scoring pairs.
・前処理「Before analysis, we carried out the following preprocessing steps on both datasets: base 10 logarithmic trasformation; and for each gene, subtract the mean and divide by the standard deviation.
・遺伝子ランキング法のまとめ「A large number of measures have been proposed for scoring genes, starting with Golub et al.[2] that proposed using |(μ12)/(σ12)|. Other gene measures in the literature include both non-parametric measures like the TNoM score of Ben-Dor et al.[17] and information gain (proposed by Xing et al. [6]), and parametric measures like t-score[7], Fisher score[13], naive Bayes global relevance [18] and between- to within-variance ratio [16].

・この場合も識別率が悪い所から始まって指数関数的に上昇する。なぜ?
コメント
  • X
  • Facebookでシェアする
  • はてなブックマークに追加する
  • LINEでシェアする

【論】Ambroise,2002,Selection bias in gene extract~

2007年01月27日 20時48分06秒 | 論文記録
Christophe Ambroise and Geoffrey J. McLachlan
Selection bias in gene extraction on the basis of microarray gene-expression data
Proc Natl Acad Sci U S A. 2002 May 14;99(10):6562-6
[PDF][Web Site]

・マイクロアレイデータを用いたサンプル識別時に発生する"Selection bias"の問題についての考察。複数の識別法を使い、それぞれの識別率(Error rate)を比較する。
・識別法
1.AE : Apparent error rate of the rule R
2.CV1IE : CV (leave-one-out) internal error
3.B.632+ : B.632+ which puts relatively more weight on the leave-one-out bootstrap error B1 [Efron and Tibshirani]
4.CV10E : CV 10-fold error
5.TE : Test error
・データ
1. Colon data, 62 tissue samples (40 tumors/22 normal tissues), 2000 human gene expressions, Affy. [Alon]
2. Leukemia, 72 tissue samples (47 ALL/25 AML), 7129 genes, Affy. [Golub]

・問題点「However, in these results the test error or the leave-one-out cross-validated error is calculated without allowance for the selection bias.
・概要「We describe how in practice the selection bias can be assessed and corrected for by either performing a cross-validation or applying the bootstrap external to the selection process.
・LOOCVの特性「The leave-one-out CV errors is nearly unbiased, but it can be highly variable.
・結論「Hence it seems that the selection method and the number of selected genes are more important than the classification method for constructing a reliable prediction rule.

・Error rate がゼロにベッタリへばりつくのはよろしくない、って話?
コメント
  • X
  • Facebookでシェアする
  • はてなブックマークに追加する
  • LINEでシェアする

【論】Furlanello,2003,Entropy-based gene ranking ~

2007年01月24日 20時08分57秒 | 論文記録
Cesare Furlanello, Maria Serafini, Stefano Merler, and Giuseppe Jurman
Entropy-based gene ranking without selection bias for the predictive classification of microarray data
BMC Bioinformatics. 2003; 4: 54.
[PDF][Web Site]

・新しい遺伝子ランキング法について。従来のRFEを改良したE-RFEの提案。計算に使用する遺伝子をEntropyの値によってふるいにかけ(or 次元圧縮?)計算量を減らし処理の高速化を計る。
・データ(二群)
1. Colon cancer, 2000 genes, 62 tissues (22 normal/40 tumor, Affy.) [Alon]
2. Lymphoma, 4026 genes, 96 samples (72 cancer/24 non cancer, cDNA) [Alizadeh]
3. Tumor vs. metastases, 16063 genes, 76 samples (64 primary adeno-carcinomas/12 metastatic adeno-carcinomas, Affy) [Ramaswamy]

・方法「We have developed the entropy-based recursive feature elimination (E-RFE) as a non-parametric procedure for gene ranking, which accelerates - without reducing accuracy - the standard recursive feature elimination (RFE) method for SVMs[6].
・方法「In our E-RFE method, we cautiously discard, according to the entropy of the weight distribution, several (possibly many) genes at each step to drive the weight distribution in a high entropy structure of few equally important variables
・人工データ1-1「We considered first the dataset f1000-5000, structured as follows: 100 samples described by 5000 features, in which 1000 of them are significant (i.e. generated by 1000 Gaussian distribution centered in 1 and -1, with standard deviation uniformly ranging between 1 and 5), and the remaining are uniform noise in the range [-2, 2].
・人工データ1-2「We set up a second data set of 100 samples described by 5000 uniform noise features in the range [-2, 2].
・「Surprisingly, when the procedure was applied to the same data after a label randomization, a very similar result was obtained without any class information
・「We have analyzed the results obtained by applying an optimal number of features (ONF) procedure designed to compute an approximate estimate of the optimal number of features n* for microarray data sets.
・人工データ2「We considered two synthetic data sets, each of 100 cases (50 labeled 1 and 50 labeled -1) described by 1000 features: the 1000 features in U1 were all uniformly distributed in the interval [-2, 2] and thus not discriminating the classes. The second data set U2 was derived from U1 by keeping unvaried 995 features and introducing 5 features normally distributed with mean 1 or -1 according to class, and variance 1.5.
・結論「Also considering the results of the experiments with no-information data, we may conclude that several promising results on microarray data may be descriptive of the shattering properties of classifiers on the given microarray data sets [18,16,17].
・注意「While attempting to reproduce results from other authors, we noticed the existence of a "preprocessing bias", also mentioned in [16].

・内容てんこ盛り&処理ステップが多く、さらっと読むだけでは内容がつかみきれない。
・"Selection bias"の概念がイマイチ理解できず。単純に、選択する遺伝子によって識別率が変わってくるという話?
~~~~~~~
・80本を超えたところでようやく"これだ!"という論文に突き当たりました。遅すぎ。英語の勉強も兼ねてフラフラのんびり読んでいたこともありますが。ともかく、この論文の内容の一部と今自分が考えている事が、その骨組みにおいてかなり近いものでした。国は全く違っても、人間、同じようなこと考えるんだなぁ、と変に感心しました。「先にやられた!」という不安感よりも、「今やっている内容は論文になるだけの価値がある」ことが確認できた安心感が大きいです。ようやく2003年レベルまで追いついた!? あとは2007年のレベルまで話を進めるだけ。
・今回から、可能な限り読むときは音読を心がけようと思います。
コメント
  • X
  • Facebookでシェアする
  • はてなブックマークに追加する
  • LINEでシェアする

【論】Fang,2005,Knowledge guided analysis of micro~

2007年01月19日 19時54分21秒 | 論文記録
Zhuo Fang, Jiong Yang, Yixue Li, Qingming Luo, Lei Liu
Knowledge guided analysis of microarray data
Journal of Biomedical Informatics archive Volume 39 ,Issue 4(August 2006)Pages:401-411
[PDF]

・従来の発現量数値データのみに基いて計算する数学的クラスタリング法に対して、Gene Ontology (GO)の手法により生物学的知識を取り入れたクラスタリング法を提案する。
・データ
1.Yeast, 2467 genes, 79 conditions [Eisen]
2.Yeast cell cycle, 6220 mRNA species, 17 time points [Cho]
・クラスタリング結果の評価は、アノテーションとの相関を示す関数(WF)を使用。

・問題点「However, all of these algorithms only pay attention to mathmatical similarity of genes and conditions, while the biological meaning of clusters is still neglected.
・GOとは「gene ontology (GO), a large hierarchical vocabulary describing gene product functions in an organism-independent fashion,
・処理「There, firstly, a GO tree is constructed from GO data file. Subsequently, genes involved in the expression dataset are mapped to this GO tree via species related database, and unmapped nodes (terms) in GO tree are excluded. Thereafter, every node in this GO tree is checked from top to bottom.
・問題点「In most of the cases, it is hard to interpret the clustering results, because some genes in the same cluster might have no biological similarity at all.
・長所「Obviously, our clustering method will produce clusters with high similarities of both expression and function.

・GOの考え方はサッパリわからず。
・計算の結果、クラスター数が数百とやたら細かく分かれているが、問題ないのか?
コメント
  • X
  • Facebookでシェアする
  • はてなブックマークに追加する
  • LINEでシェアする

【論】Verr,2002,Gene expression profiling predicts ~

2007年01月13日 22時18分53秒 | 論文記録
Vant't-Verr Laura J., Dai Hongyue, Van-de-Vijver Marc J., He Yudong D., Hart Augustinus A.M., Mao Mao, Peterse Hans L., Van-der-Kooy Karin, Marton Matthew J., Witteveen Anke T., Schreiber George J., Kerkhoveb Ron M., Roberts Chris, Linsley Peter S., Bernards Rene, Friend Stephen H.
Gene expression profiling predicts clinical outcome of breast cancer
Nature, 415, pp.530-536, 2002.
[PDF][Web Site]

・遺伝子発現プロファイルを使った乳癌の予後診断。
・データ:ヒト(乳癌)、98サンプル、約25000遺伝子のうち約5000遺伝子を抽出して解析。
・解析法
1.Unsupervised two-dimensional clustering:診断につかう遺伝子を抽出する
2.Supervised classification:予後診断の評価に使用

・問題点「The strongest predictors for metastases (for example, lymph node status and histological grade) fail to classify accurately breast tumours according to their clinical behaviour.
・方法(の一部)「Third, the number of genes in the 'prognosis classifier' was optimized by squentially adding subsets of 5 genes from the top of this rank-ordered list and evaluating its power for correct classification using the 'leave-one-out' method for cross-validation

・マイクロアレイを使った病理診断についてのお手本のような内容。
コメント
  • X
  • Facebookでシェアする
  • はてなブックマークに追加する
  • LINEでシェアする

【論】Balasubramaniyan,2005,Clustering of gene expre~

2007年01月10日 21時43分00秒 | 論文記録
Rajarajeswari Balasubramaniyan, Eyke H?llermeier, Nils Weskamp and J?rg K?mper
Clustering of gene expression data using a local shape-based similarity measure
Bioinformatics 2005 21(7):1069-1077
[PDF]

・時系列のマイクロアレイデータによる遺伝子のクラスタリング法を提案する。
・データ:Yeast, mitotic cell cycle time course experiment, 17 time points, 6331 ORFs [Cho,1998]
・クラスタリングに用いる指標
1.Spearman rank correlation(SRC、提案法)
2.Pearson correlation(従来法)
3.Euclidean distance(従来法)
・評価法:クラスタリング結果とMIPSデータベースの情報をひき比べて評価する(遺伝子機能推定)

・提案法「Here, we propose a new method (CLARITY; Clustering with Local shApe-based similaRITY) for the analysis of microarray time course experiments that uses a local shape-based similarity measure based on Spearman rank correlation. This measure does not require a normalization of the expression data and is comparably robust towards noise.
・注意「Let us finally note that not all clusters show a significant enrichment for any of the fuctional categories. It can be assumed that the genes in these clusters participate in several of the processes defined by the fuctional categories.

・従来法よりも狭い窓を使ってデータを見ていくので、よりノイズに強い、ということらしい。
コメント
  • X
  • Facebookでシェアする
  • はてなブックマークに追加する
  • LINEでシェアする

【論】Bolstad,2003,A comparison of normalization me~

2007年01月06日 18時25分01秒 | 論文記録
B.M.Bolstad, R.A.Irizarry, M.Astrand and T.P.Speed
A comparison of normalization methods for high density oligonucleotide array data based on variance and bias
Bioinformatics Vol. 19 no. 2 2003 Pages 185-193
[PDF]

・マイクロアレイデータの正規化法を提案する。
・提案する正規化法 : Complete data methods (Bioconductorに同梱)
1.Cyclic Loess
2.Contrast based method
3.Quantile normalization
・比較する従来の正規化法
1.Scaling methods : the standard Affymetrix normalization
2.Non-linear method [Schadt, Li and Wang](dChipで使用)
・データ
1.Dilution/Mixture Data : 75 HG-U95A (version 2) arrays [GeneLogic,2002]
2.Spike-in Data : 98 HG-U95A (version 1) arrays [GeneLogic,2002]

・提案法の特長「We propose three different methods of normalizing probe intensity level oligonucleotide data, none of which is dependent on the choice of a baseline array. Normalization is carried out at probe level fot all the probes on an array.
コメント
  • X
  • Facebookでシェアする
  • はてなブックマークに追加する
  • LINEでシェアする