goo blog サービス終了のお知らせ 

ぴかりんの頭の中味

主に食べ歩きの記録。北海道室蘭市在住。

【論】Smolkin,2003,Cluster stability scores for micr~

2007年08月08日 21時45分49秒 | 論文記録
Mark Smolkin and Debashis Ghosh
Cluster stability scores for microarray data in cancer studies
BMC Bioinformatics 2003, 4:36 doi:10.1186/1471-2105-4-36
[PDF][Web Site]

・サンプルのクラス分けについて、そのクラスの数ではなく、安定度(Cluster stability scores; Random subspace methods)で評価する。
・データ
1.Childhood cancer [Khan]
2.B-Lymphoma [Alizadeh]
3.Cutaneous melanoma [Bittner]
・クラス分け法:Hierarchical clustering (Average linkage, Complete linkage)
・比較したクラス分けの評価法
1.R-index [McShane]
2.The cluster scoring method [Tibshirani]

★実験1:クラス数を既知として処理
★実験2:クラス数を未知として処理

・使用した "R" のコードは以下からダウンロード可能。
http://www.sph.umich.edu/~ghoshd/COMPBIO/CSS/

・問題点「While most work has focused on estimating the number of clusters in a dataset, the question of stability of individual-level clusters has not been addressed.
・概要「We address this problem by developing cluster stability scores using subsampling techniques. These scores exploit the redundancy in biologically discriminatory information on the chip. Our approach is generic and can be used with any clustering method.
・手順「Two approaches are taken in this paper. For the first, we assume that the number of clusters is known; sensitivity measures using random subspace methods are calculated. In the second situation, the number of clusters is unknown. We address this problem by proposing a two-stage procedure in which the number of clusters is estimated at the first stage and sensitivity measures are calculated at the second.

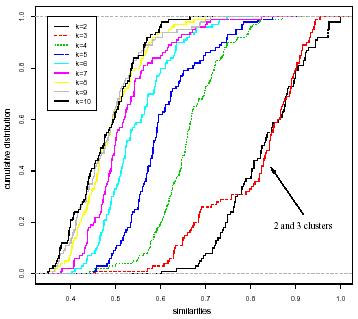
・サンプル全体からランダムに一部のサンプルを抽出しクラス分け。これを繰り返して、同じ結果になる率が高いクラスほど安定度の点数が高くなる、ということらしい(間違ってるかも)。
コメント
  • X
  • Facebookでシェアする
  • はてなブックマークに追加する
  • LINEでシェアする

【論】Monti,2003,Consensus Clustering: A Resampling-~

2007年08月04日 20時54分59秒 | 論文記録
Stefano Monti, Pablo Tamayo, Jill Mesirov and Todd Golub
Consensus Clustering: A Resampling-Based Method for Class Discovery and Visualization of Gene Expression Microarray Data
Machine Learning 2003, 52:91-118.
[PDF][Web Site]

・クラス識別法として、Consensus Clustering を提案する。
・データ
1.人工データ:パラメータを変えた6種
2.生体データ:Leukemia [Golub,1999], Novartis multi-tissue [Su,2002], St. Jude leukemia [Yeoh,2002], Lung cancer [Bhattacharjee,2001], CNS tumors [Pomeroy,2002], Normal tissues [Ramaswamy,2001]
・クラス分け法
1.Consensus clustering + Hierarchical clustering
2.Consensus clustering + Self-organizing map
3.Gap static + Hierarchical clustering
4.Gap static + Self-organizing map

・問題点「Fundamental issues to be addressed when clustering data incude: (i) how to determine the number of clusters; and (ii) how to assign confidence to the selected number of clusters, as well as to the induced cluster assignments.
・特徴「One of the important features of the proposed methodology is that all of the information provided by the analysis of the resampled data can be graphically visualized, and incorporated in the decisions about clusters' number and cluster membership.
・方法「The basic assumption of this method is intuitively simple: if the data represent a sample of items drawn from distinct sub-populations, and if we were to observe a different sample drawn from the same sub-populations, the induced cluster composition and number should not be radically different. Therefore, the more the attained clusters are robust to sampling variability, the more we can be confident that these clusters represent real structure.
・注意点「Feature selection for clustering purposes is a particularly difficult task, since a class label to guide this selection is not available.
・結論「Ultimately, in the experiments we carried out, what semmed to work best was a model selection process based on a combination of the information coming from the consensus distribution and from the visual inspection of the ordered consensus matrices.

・アルゴリズムがさっぱり理解できず。 "Consensus"?? "Adjusted Rand index"??
コメント (4)
  • X
  • Facebookでシェアする
  • はてなブックマークに追加する
  • LINEでシェアする

【論】Ohmori,2005,Assessment of human stress and dep~

2007年08月01日 21時25分04秒 | 論文記録
Tetsuro Ohmori, Kyoko Morita, Toshiro Saito, Masayuki Ohta, Shu-ichi Ueno,and Kazuhito Rokutan
Assessment of human stress and depression by DNA microarray analysis
J. Med. Invest. 52 Suppl.:266-271, November,2005
[PDF][Web Site]

・マクロアレイによるストレス測定とうつ病の診断。遺伝子は末梢血液の白血球より採取。
★実験その1:ストレス測定
・遺伝子データベースの情報を基に、ストレスに反応する遺伝子1467個を選抜し、マイクロアレイをデザイン。
・被験者は博士課程の学生。論文の口頭発表(ストレス)の前後でサンプルを採取し比較する。
★実験その2:うつ病診断
・うつ病患者と健常者のサンプルを比較。

・問題点「Precise assessment of stress is an imminent issue to deal with stress-related social, medical and psychological problems.
・問題点「Measurement of one of these hormones or cytokines has been used to objectively assess the levels of stress. However, their usefulness as a biological marker is limited, because of the unsatisfactory sensitivity and/or specificity.
・概要「In a series of studies, we have developed a cDNA array specifically designed to measure the mRNA levels of stress-related genes in periheral blood leukocytes (12).
・結果「Thus, psychological stress actives multiple signaling pathways ; therefore it is difficult to fully explain the biological significance of several other genes. With regard to the significantly down-regulated genes, however, the life event stress generally downregulated mRNA expression for growth-related genes and cytochrome c oxidase subunits.
・問題点「However, studies have shown that depression, which lacks specific objective findings, if often missed or undiagnosed (25).
・結果「These alterations were different from those observed in volunteers after stress or those in preliminary samples of patients with schizophrenia.
・利点「The microarray method has a great advantage over pervious biological markers in that it can utilize hundreds of parameters from a small amount of peripheral blood cells.

・これまでの研究はガンをはじめとする "肉体" の領域の診断が主だったが、ストレスやうつ病などの "精神" の領域の診断に応用するという野心的なテーマ。血液さえ検査すれば、たとえ黙っていたとしても精神的疾患が診断できてしまうというのは、ちょっとオドロキ。将来は性格検査なんかも血液検査(遺伝子)でできてしまうのでしょうか。
・図や表は一切無くテキストオンリー。こんなんでも論文として通るのですねぇ。
コメント
  • X
  • Facebookでシェアする
  • はてなブックマークに追加する
  • LINEでシェアする

【論】Bertoni,2007,Model order selection for bio- ~

2007年07月25日 19時23分13秒 | 論文記録
Alberto Bertoni and Giorgio Valentini
Model order selection for bio-molecular data clustering
BMC Bioinformatics 2007, 8(Suppl 2):S7
[PDF][Web Site]

・マイクロアレイデータのクラス分け法として、MOSRAM (Model Order Selection by RAndomized Maps) を提案する。
・データ
1. Synthetic data, 1000-dimensional synthetic multivariate gaussian data set (sample1) with relatively low cardinality (60 examples), characterized by a two-level hierarchical structure.
2. Leukemia [Golub]
3. Lymphoma [Alizadeh]
・比較したクラス分け法
1. Class. risk [Lange et al 2004]
2. Gap statistic [Tibshirani et al 2001]
3. Clest [Dudoit and Fridlyand 2002]
4. Figure of Merit [Levine and Domany 2001]
5. Model Explorer [BenHur et al 2002]
・生物学的知識によるクラス分けを正解とし、これにいかに近い最適クラス数をはじき出すかで評価する。
・MOSRAM は mosclust R package で実行可能。

・問題点「A drawback of most clustering algorithms is that they cannot automatically detect the "natural" number of clusters underlying the data, and in many cases we have no enough "a priori" biological knowledge to evaluate both the number of clusters as well as their validity.
・方法「We propose a stability method based on randomized maps that exploits the high-dimensionality and relatively low cardinality that characterize bio-molecular data, by selecting subsets of randomized linear combinations of the input variables, and by using stability indices based on the overall distribution of similarity measures between multiple pairs of clusterings performed on the randomly projected data.
・概要「In this paper we extend the Smolkin and Gosh approach to more general randomized maps from higher to lower-dimensional subspaces, in order to reduce the distortion induced by random projections. Moreover, we introduce a principled method based on the Johnson and Lindenstrauss lemma [19] to properly choose the dimension of the projected subspace.

・アルゴリズムに "random" の要素が入るところがミソらしいが……なんだかよくわからず。
コメント
  • X
  • Facebookでシェアする
  • はてなブックマークに追加する
  • LINEでシェアする

【論】Pan,2002,A comparative review of statistical ~

2007年07月22日 11時27分40秒 | 論文記録
Wei Pan
A comparative review of statistical methods for discovering differentially expressed genes in replicated microarray experiments
Bioinformatics Vol.18 no.4 2002 Pages 546-554
[PDF]

・遺伝子抽出法の性能比較。t-test [図1段目]と、それの Regression medeling approach [Thomas; 2段目] と Mixture modeling approach [Pan; 3段目] の三法。
・データ:Leukemia (ALL/AML) data [Golub]
・評価法:Wilcoxon rank sum test と、遺伝子のアノテーションによる生物学的評価。
・おまけとして、Significance Analysis of Microarray (SAM) [Tusher]と 、Empirical Bayesian method [Efron] とも比較。

・問題点と目標「However, it may not be clear how these methods compare with each other. Our main goal here is to compare three methods, the t-test, regression medeling approach and a mixture model approach with particular attention to their different modeling assumptions.
・人工データ「A general statistical model is  Yjk = aj + bjxk + ejk  where xk = 1 for 1 <k < K and xk = 0 for K1 + 1 <k < K + K2, and ejk are random errors with mean 0.
・問題点「A common problem with the above t-test and the regression approach is their strong assumption on the null distributions of the test statistics.
・特長「The method takes full advantage of the existence of replicated data, but it does require that both K1 and K2 are even numbers.
・注意「However, the specific ranking may be very different methods used in preprocessing the data.
コメント
  • X
  • Facebookでシェアする
  • はてなブックマークに追加する
  • LINEでシェアする

【論】Datta,2006,Methods for evaluating clustering ~

2007年07月17日 22時44分40秒 | 論文記録
Susmita Datta and Somnath Datta
Methods for evaluating clustering algorithms for gene expression data using a reference set of functional classes
BMC Bioinformatics 2006, 7:397
[PDF][Web Site]

・クラス分け法の評価法として、Gene ontology (GO)データベースの知識を利用したBiological homogeneity index (BHI)とBiological stability index (BSI)の、二つの方法を紹介する。
・データ
1.Human breast cancer progression data, 258 genes, 4 normal/7 ductal carcinoma [Abba]
2.Yeast sporulation data, 513 genes [Chu]
・クラス分け法(※いずれも 'R' で実行可能)
1.2.UPGMA (Pearson's correlation coefficient, Euculidian distance), Agglomerative hierarchical clustering algorithm
3.4.Diana (Pearson's~, Euculidian~)
5.6.Fanny (Pearson's~, Euculidian~)
7.K-means
8.SOM (Self-organizing maps)
9.Model based clustering
10.SOTA (Self-oragnising tree algorithm)

・問題点「One potential difficulty with this approach is that a quantitative conversion of biological attributes is needed (which may not be natural and may not preserve the information content).
・概要「In this paper, we introduce two performance measures for evaluating the results of a clustering algorithm in its ability to produce biologically meaningful clusters. The first measure is a biological homogeneity index (BHI). As the name suggests, it is a measure of how biologically homogeneous the clusters are.(中略)The second performance measure is called a biological stability index (BSI). For a given clustering algorithm and an expression data set, it measures the consistency of the clustering algorithm's ability to produce biologically meaningful clusters when applied repeatedly to similar data sets.(中略)We evaluated the performance of ten well known clusering algorithms using this dual measures approach on two gene expression data sets and identified the optimal algorithm in each case.
・意義「However, for clustering biological data such as the gene expression profiles, it would be reasonable to consider external measures that employ the existing biological knowledge (which can be taken as the "ground truth").
・問題点「Such conclusions are inherently incomplete unless one can quantify the agreement between the clusters produced via the expression profiles and the biological classes because it is likely that many biologically unrelated genes will be grouped together as well.
・利点「The proposed indices are easy to interpret and easy to implement. They are also useful in identifying the optimal clustering algorithm for a given data set in its ability to cluster biologically similar genes.

・GOについての勉強が必要かも。アノテーションの情報がなぜ数式につっこめるのか不思議。
コメント
  • X
  • Facebookでシェアする
  • はてなブックマークに追加する
  • LINEでシェアする

【論】West,2001,Predicting the clinical status of ~

2007年07月11日 19時09分57秒 | 論文記録
Mike West, Carrie Blanchette, Holly Dressman, Erich Huang, Seiichi Ishida, Rainer Spang, Harry Zuzan, John A. Olson Jr., Jeffrey R. Marks, and Joseph R. Nevins
Predicting the clinical status of human breast cancer by using gene expression profiles
PNAS September 25, 2001 vol. 98 no. 20 11462-11467
[PDF][Web Site]

・遺伝子発現データに基づく乳ガンの診断
・データ:Breast cancer, Duke Breast Cancer SPORE frozen tissue bank より提供された組織, Affy

・問題点「Traditional methods of phenotypic characterization are often limited and do not have the ability to discern subtle differences that may be of importance for developing a better understanding of the tumor and advancing therapeutic strategies for the treatment of disease.
・「The analysis of gene expression represents an indirect measure of the genetic alterations in tumors because, in most instances, these alterations affect gene regulatory pathways.
・解析法「Analysis uses binary regression models combined with singular value decompositions (SVDs) and with stochastic regularization by using Baysian analysis
・「We note that, in some applied contexts, the levels of extraneous noise may be lower than in the complex and challenging case of breast cancer;
・処理「The binary regression model was then fitted to the set of 100 selected genes by using the resulting SVD factors on the basis of these 100 genes.
・問題点「ER status is simply difficult to determine, because of either within-tumor heterogeneity or changes over time in protein levels.

・内容が読み取りずらい。解析法よりもデータがメイン。
コメント
  • X
  • Facebookでシェアする
  • はてなブックマークに追加する
  • LINEでシェアする

【論】Yu,2007,Feature Selection and Molecular Classi~

2007年07月07日 16時36分48秒 | 論文記録
Jianjun Yu, Jindan Yu, Arpit A Almal, Saravana M Dhanasekaran, Debashis Ghosh, William P Worzel, and Arul M Chinnaiyan
Feature Selection and Molecular Classification of Cancer Using Genetic Programming
Neoplasia. 2007 April; 9(4): 292-303.
[PDF][Web Site]

・遺伝子抽出とサンプルクラス分け法として、GP (Genetic Programming) を応用する。クラス分けの結果を繰り返しフィードバックし、最適な遺伝子セットを抽出する。
・データ
1.SRBCT data (NB, RMS, BL, EWS) [Khan]
2.Lung adenocarcinoma data(high-risk group and low-risk group) [Beer]
3.Three prostate cancer data (benign prostate samples (BENIGN) and PCA) [Lapointe, Dhanasekaran, Yu]
4.Two prostate cancer data (PCA and MET) [LaTulippe, Yu]
・比較法
1.Compound covariate predictor
2.3-Nearest neighbors
3.Nearest centroid
4.SVMs
5.DLDA

・GPとは「Genetic programming (GP) is a type of machine learning technique that uses evolutionary algorithm to simulate natural selection as well as population dynamics, hence leading to simple and comprehensible classifiers.
・問題点「However, the potential of GP in cancer classification has not been fully explored. For example, GP classifiers indentified from one data set have not been validated in independent data sets.
・特徴「Examination of classifier genes have revealed that GP classifiers (Table 4 and 5) are much simpler than predictors reported by other approaches, where more than 10 genes are often requied to build an effective predictor. GP, by contrast, can use only 2 to 5 genes to produce effective classifiers and achive high prediction power.
・特徴「A major difference between GP and other machine learning techniques is its mathematical connections between genes within a classifier.
・特徴「An inrinsic advantage of GP is that it automatically selects a small number of feature genes during "evoliution".
・特徴「However, GP has added advantages over other algorithms. Its special features include the following: 1) the ability to automatically select a small number of genes as potential discriminative genes, 2) the ability to combine such genes and construct a simple and comprehensible classifier, and 3) the capability to generate multiple candidate classifiers.

・Evolutionary algorithm が分かっていない[図]。cDNAとAffyのデータを混ぜて計算しているのが目新しい。
コメント
  • X
  • Facebookでシェアする
  • はてなブックマークに追加する
  • LINEでシェアする

【論】Yousef,2007,Recursive Cluster Elimination(RCE)~

2007年07月04日 20時04分58秒 | 論文記録
Malik Yousef, Segun Jung, Louise C Showe and Michael K Showe
Recursive Cluster Elimination (RCE) for classification and feature selection from gene expression data
BMC Bioinformatics 2007, 8:144
[PDF][Web Site]

・遺伝子抽出とサンプルクラス分けの方法として、RCE (Recursive Cluster Elimination) を提案する。従来のRFE (Recursive Feature Elimination) が個々の遺伝子に着目していたのに対して、RCEでは遺伝子の集団(Cluster)に着目して処理を行う。
・データ:1.Leukemia [Golub], 2.Prostate, 3・4.CTCL Datasets (I) and (II), 5・6.Head & neck vs. lung tumors(I) and (II)
・比較法:SVM-RFE、PDA-RFE

・現状「Although wrapper methods appear to be more accurate, filtering metods are presently more frequently applied to data analysis than wrapper methods [4].
・特徴「The SVM-RCE method differs from related classification methods in that it first groups genes into correlated gene clusters by K-means and then evaluates the contributions of each of those clusters to the classification task by SVM.
・「However, none of the previous studies used K-means to cluster features and none are concerned with feature reduction, the principal aim of our method.
・概要「In this paper we present a novel method SVM-RCE for selecting significant genes for (supervised) classification of microarray data, which combines the K-means clustering method and SVM classification method. SVM-RCE demonstrated improved (or equivalent in one case) accuracy compared to SVM-RFE and PDA-RFE on 6 microarray datasets tested.
・問題点「The relationship between the genes of a single cluster and their functional annotation is still not clear.
・問題点「However, the exact relation between the weights and performance is not well understood. One could argue that some genes with low absolute weights are important and their low ranking is a result of other dominant correlated genes.
・アルゴリズム「The basic approach of the SVM-RCE is to first cluster the gene expression profiles into n clusters, using K-means. A score Score(X(si,f,r), is assigned to each of the clusters by linear SVM, indicating its success at separating samples in the classification task. The d% clusters (or d clusters) with the lowest scores are then removed from the analysis.
・「Additionally, althrough both methods remove the least important genes at each step, SVM-RCE scores and removes clusters of genes, while SVM-RFE scores and removes a single or small numbers of genes at each round of the algorithm.

・"個々の遺伝子" から "遺伝子の集団" に計算対象を変えるとナゼ性能が上がるのかに興味があるが、その点は特に言及無し。
コメント
  • X
  • Facebookでシェアする
  • はてなブックマークに追加する
  • LINEでシェアする

【論】Tibshirani,2001,Diagnosis of multiple cancer ~

2007年06月30日 22時00分22秒 | 論文記録
Robert Tibshirani, Trevor Hastie, Balasubramanian Narasimhan, and Gilbert Chu
Diagnosis of multiple cancer types by shrunken centroids of gene expression
PNAS May 14, 2002 vol. 99 no. 10 6567-6572
[PDF][Web Site]

・Shurunken centroids を利用したクラス分け法の提案。
・データ
1.SRBCT, 63 training/25 test samples, 2308 genes [Khan]
2.Leukemia, 20 ALL/14 AML samples, 7129 genes [Golub]

・概要「We have devised an approach to cancer class prediction from gene expression profiling, based on an enhancement of the simple nearest prototype (centroid) classifier.
・「Our method of "nearest shrunken centroids" identifies subsets of genes that best characterize each class.
・「we propose a simple modification of the nearest-centriod, called "nearest shrunken centroid." This approach uses "de-noised" versions of the centroids as prototypes for each class.
・問題点「The problem of classification by microarrays is challenging because:
・there is a large number of classification by microarrays is challenging because:
・there are a large number of inputs (genes) from which to predict classes and a relatively small number of samples, and
・it is important to identify which genes contribute most to the classification.

・目的「One goal of our method is to find the smallest set of genes that can accurately classify samples.

・従来の nearest centroid よりも条件を厳しくして遺伝子を厳選する、ということらしいが、方法のキモ(どういう基準で?)がいまいちつかめず。論文をさかのぼらないとダメか。
コメント
  • X
  • Facebookでシェアする
  • はてなブックマークに追加する
  • LINEでシェアする