


d <- c(rep(5,10000), rep(15, 1000), rep(25, 100), rep(35,10), rep(45,1))
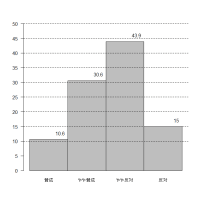
hist(d, breaks=seq(0,50,10))
d01 <- cut(d,breaks=seq(0,50,10),labels=c("00点台","10点台","20点台","30点台","40点台"), right = FALSE, include.lowest = TRUE)
d02 <- table(d01)
boxplot(d02)
> cut(x,breaks=c(0,80,100), labels=c("不合格","合格"), right = FALSE, include.lowest = TRUE)
hist(d, breaks=seq(0,50,10))
d01 <- cut(d,breaks=seq(0,50,10),labels=c("00点台","10点台","20点台","30点台","40点台"), right = FALSE, include.lowest = TRUE)
d02 <- table(d01)
boxplot(d02)
> cut(x,breaks=c(0,80,100), labels=c("不合格","合格"), right = FALSE, include.lowest = TRUE)


※コメント投稿者のブログIDはブログ作成者のみに通知されます