| 論文番号 | 著者名 | 論文タイトル名 | 発表雑誌名 | 巻、号 | ページ | 出版年 |
| 論文#17 | Hattori Y, Akimoto K, Gross SS, Hattori S, Kasai K | Angiotensin-II-induced oxidative stress elicits hypoadiponectinaemia in rats | Diabetologia | 48 | 1066-1074 | 2005 |
| 論文#19 | Hattori S, Hattori Y, Kasai K | Hypoadiponectinemia is caused by chronic blockade of nitric oxide synthesis in rats | Metabolism | 54 | 482-487 | 2005 |
(A)- 指摘項目No.23
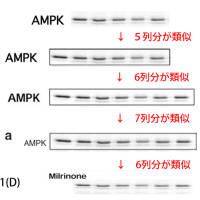
論文#17のFigure 3(B)のadiponectinのmRNAの6列の画像のうち、右3列(左から4列目、5列目、6列目)がそれぞれ互いに類似しており、極めて不自然なため、画像の流用(データ捏造)が疑われます。
(A)- 指摘項目No.24
さらに、論文#17のFigure 3(B)が、論文#19のFigure 2(B)と、類似しています。
論文#17では、AngIIとAngII+Tempol(or BH4)の効果を見ているのに対し、
論文#19では、L-NAMEの効果を見ています。
それにもかかわらず、二つの画像が類似していることは不自然であり、画像の流用(データ捏造)が疑われます。
(A)- 指摘項目No.25
また、
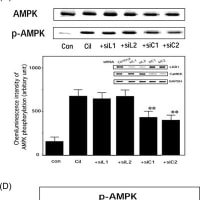
論文#17のFigure 3(C)が、論文#19のFigure 3(B),(C)と、類似しています。
論文#17では、AngIIと、AngII+Tempol(or BH4)の効果を見ているのに対し、
論文#19では、L-NAMEと、L-NAME+pioglitazone(or allopurinol)の効果を見ています。
それにもかかわらず、二つの画像が類似していることは極めて不自然であり、少なくともどちらかの論文が捏造されたものであると断定できます(データの流用)。
(A)- 指摘項目No.26
また、
この論文#17のFigure 3(C)のAdiponectinのAngIIの二つの画像(上の画像と下の画像)は、互いに類似しており、画像の流用(データ捏造)が疑われます。
↓上記論文#17のFigure 3(b)

Hattori Y et. al. DIABETOLOGIA Volume 48, Number 6, 1066-1074, Figure 3b
Copyright © 2005, Springer Berlin / Heidelberg
Fig. 3 a Plasma adiponectin levels in adipose tissue as determined by ELISA using a kit for the measurement of rat/mouse adiponectin. The results are expressed as means±SEM (n=7). b, c Adiponectin mRNA levels in adipose tissue as assessed by northern blot analysis. The results are expressed as means±SEM (n=3). *p<0.01 vs the control value
↓上記論文#17のFigure 3(c)

Copyright © 2005, Springer Berlin / Heidelberg
Hattori Y et. al.DIABETOLOGIA Volume 48, Number 6, 1066-1074, Figure 3c
Fig. 3 a Plasma adiponectin levels in adipose tissue as determined by ELISA using a kit for the measurement of rat/mouse adiponectin. The results are expressed as means±SEM (n=7). b, c Adiponectin mRNA levels in adipose tissue as assessed by northern blot analysis. The results are expressed as means±SEM (n=3). *p<0.01 vs the control value
↓上記論文#19のFigure 2
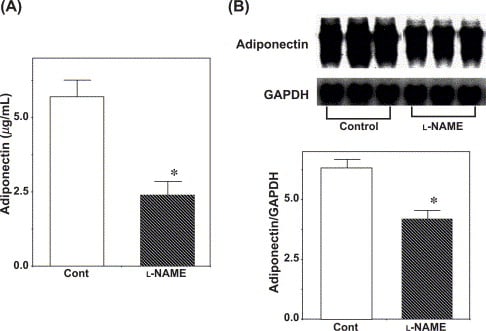
Copyright 2005 Elsevier Inc. All rights reserved.
Metabolism Clinical and Experimental 54 (2005) 482– 487
Fig. 2. Plasma adiponectin concentration (n = 8) (A) and adiponectin mRNA levels in adipose tissue (n = 3) (B). *P
↓上記論文#19のFigure 3

Copyright 2005 Elsevier Inc. All rights reserved.
Metabolism Clinical and Experimental 54 (2005) 482– 487
Fig. 3. Effects of pioglitazone and allopurinol on plasma adiponectin concentration (n = 8) (A) and adiponectin mRNA levels in adipose tissue (B and C). *P < .01 vs control group.