裏 RjpWiki

Julia ときどき R, Python によるコンピュータプログラム,コンピュータ・サイエンス,統計学

Julia に翻訳--231 正規分布の密度関数を描く

2021年05月20日 | ブログラミング

#==========
Julia の修行をするときに,いろいろなプログラムを書き換えるのは有効な方法だ。
以下のプログラムを Julia に翻訳してみる。

正規分布の密度関数を描く
https://oku.edu.mie-u.ac.jp/~okumura/python/dnormcurve.html

ファイル名: dnormplot.jl  関数名:

翻訳するときに書いたメモ

==========#

> 正規分布の密度関数を描く

> まずは Matplotlib と NumPy だけで描いてみましょう。

> import matplotlib.pyplot as plt
> import numpy as np

> x = np.linspace(-3, 3, 101)  # 区間[-3,3]を100等分する101点
> y = np.exp(-x**2 / 2) / np.sqrt(2 * np.pi)
> plt.plot(x, y)

using Plots
pyplot(grid=false, label="")

densityfunction(x) = exp(-x^2 / 2) / sqrt(2π)
x = range(-3, 3, length=101);  # 区間[-3,3]を100等分する101点
y = densityfunction.(x);
plot(x, y, tick_direction=:out) # tick_direction=:out は pyplot() では宣言できない

# plot(x , x -> exp(-x ^2 / 2) / sqrt(2π)) # 遅い

> x ≧ 1 の部分だけ塗りつぶしてみましょう。

> plt.fill_between(x[x >= 1], y[x >= 1])

x2 = range(1, 3, length=101)  # 区間[-3,3]を100等分する101点
y2 = densityfunction.(x2);

plot!(x2, y2, fill=(0, :orange))
hline!([0])
savefig("fig1.png")

> 計算式を書くのが面倒なら,SciPy の scipy.stats.norm.pdf() を使います。この pdf は PDF ファイルのことではなく確率密度関数(probability density function)のことです。

> import matplotlib.pyplot as plt
> import numpy as np
> from scipy.stats import norm

> x = np.linspace(-3, 3, 101)  # 区間[-3,3]を100等分する101点
> plt.plot(x, norm.pdf(x))

> ちなみに R なら

> curve(dnorm(x), -3, 3)

> という1行で描けてしまいます

Rmath の dnorm() というのは,結局の所 R の dnorm() です。
R の curve() は(R のなかでも plot() のシュガーコートだし)Julia の plot() と同じです。

using Rmath
x = range(-3, 3, length=101);
plot(x, dnorm.(x))

関数名だけを引数にすることも,

plot(dnorm)

値域を指定することもできます。

plot(dnorm, xlims=(-3, 3))

コメント
  • X
  • Facebookでシェアする
  • はてなブックマークに追加する
  • LINEでシェアする

Julia に翻訳--230 seaborn によるプロット,散布図行列,R の plot()

2021年05月20日 | ブログラミング

#==========
Julia の修行をするときに,いろいろなプログラムを書き換えるのは有効な方法だ。
以下のプログラムを Julia に翻訳してみる。

seabornによるプロット
https://oku.edu.mie-u.ac.jp/~okumura/python/seaborn.html

ファイル名: pairplot.jl  使用する関数名: corrplot, cornerplot

翻訳するときに書いたメモ

参照元では serborn を使っているのだけど,Julia で seaborn を使うと,当たり前の反則になるので,Julia にある関数を使って描画する。
dataset() の右上にあるのは,ヒートマップのようだが,2値のヒートマップはわかりづらいとしかいえない。
cornerplot() のほうが R の pair() に近いかな。
いずれの関数も,パラメータは決め打ちなので,最適な画像を得るためには,状況によりマージン設定,マーカーサイズ,文字サイズを自分で決める必要がある。

==========#

using Plots, Plots.PlotMeasures
using StatsPlots, DataFrames

using RDatasets
iris = dataset("datasets", "iris");

gr( grid=false,
    left_margin=5mm,
    right_margin=-5mm, # 負の値も指定できる(というか,指定しないと綺麗な図にならない)
    top_margin=-5mm,
    bottom_margin=5mm)

@df iris corrplot([:SepalLength :SepalWidth :PetalLength :PetalWidth],
    tick_direction=:out, # マニュアルにもソースプログラムにも書いていないが,オプション指定ができる
    thickness_scaling = 0.7) # thickness_scaling と 上下左右のマージン設定は必須
savefig("fig1.png")

# x = randn(500, 5);
# corrplot(x)

############

gr( left_margin=5mm,
    right_margin=-5mm, # 負の値も指定できる(というか,指定しないと綺麗な図にならない)
    top_margin=-8mm,
    bottom_margin=5mm)

@df iris cornerplot([:SepalLength :SepalWidth :PetalLength :PetalWidth],
                    tick_direction=:out, # マニュアルにもソースプログラムにも書いていないが,オプション指定ができる
                    markersize=4, thickness_scaling = 0.7) # grid は 効かない
savefig("fig2.png")

# cornerplot(x, label=["x$i" for i = 1:5])
# cornerplot(x, compact=true, label=["x$i" for i = 1:5])

コメント
  • X
  • Facebookでシェアする
  • はてなブックマークに追加する
  • LINEでシェアする

Julia に翻訳--229 Collatzの問題

2021年05月20日 | ブログラミング

#==========
Julia の修行をするときに,いろいろなプログラムを書き換えるのは有効な方法だ。
以下のプログラムを Julia に翻訳してみる。

Collatzの問題
https://oku.edu.mie-u.ac.jp/~okumura/python/collatz.html

ファイル名: collatz.jl  関数名: collatz, collatzmax

翻訳するときに書いたメモ

いきなり規模を大きくすると火傷することがあるよ。

==========#

# #= ... =# は,複数行の注釈 (C++ などの /* ... */ に相当)

#=
def collatz(n):
    print(n, end="")
    while (n > 1):
        if (n % 2 == 0):
            n = n // 2
        else:
            n = 3 * n + 1
        print(" →", n, end="")
    print()

n = int(input('正の整数を入力してください: '))
collatz(n)
=#

function collatz(n)      # 末尾コロン不要
    print(n)             # 出力末尾改行なしの出力(出力末尾改行ありは println())
    while n > 1          # 条件式をくるくるカッコ対,末尾コロン不要
        if n % 2 == 0    # 末尾コロン不要
            n = n ÷ 2    # 整数除算
        else             # 末尾コロン不要
            n = 3n + 1   # 定数*変数の演算子は省略可
        end              # if を閉じる
        print(" → $n")   # 文字列中の $変数名 は変数の値で置換される
    end                  # while を閉じる
    println()            # 何も出力せず改行のみ
end                      # function 定義の終わり

print("正の整数を入力してください: ") # プロンプト機能は特にない
n = parse(Int, readline())      # 文字列として入力し,整数にパース
collatz(n)                      # 関数呼び出し

#=====
def collatz_max(n):
    nmax = n
    while (n > 1):
        if (n % 2 == 0):
            n = n // 2
        else:
            n = 3 * n + 1
            if n > nmax:
                nmax = n
    return nmax

mmax = 0
for n in range(10000):
    m = collatz(n)
    if m > mmax:
        print(n, m)
        mmax = m
=====#

function collatzmax(n) # Julia では 変数名,関数名に _ の使用は非推奨
    nmax = n
    while n > 1
        if n % 2 == 0
            n = n ÷ 2
        else
            n = 3n + 1
            n > nmax && (nmax = n) # Perl なんかにあるやつ
        end
    end
    return nmax
end

mmax = 0
for n = 0:9999 # Python の range(10000) は 0:9999
    m = collatzmax(n)
    if m > mmax
        println(n, " ", m) # Julia では,フィールドの区切り文字は空
        mmax = m
    end
end # for も end で閉じる

図を描く Python プログラムは提示されていないが,

図を描くために少し追加

results = []
mmax = 0
limit = 1e8
for n = 1:limit
    m = collatzmax(n)
    if m > mmax
        println(n, " ", m) # Julia では,フィールドの区切り文字は空
        mmax = m
        append!(results, (n, m))
    end
end # for も end で閉じる

collatzmax を若干修正する。
途中で n より小さい値になったら,収束することがわかるの(すでにチェック済みなので)で計算打ち切りにする。
これを入れないと死ぬほど時間が掛かる。

function collatzmax(n) # Julia では 変数名,関数名に _ の使用は非推奨
    n0 = n # 後々のために追加
    nmax = n
    while n > 1
        if n % 2 == 0
            n = n ÷ 2
        else
            n = 3n + 1
            n > nmax && (nmax = n) # Perl なんかにあるやつ
        end
        n < n0 && break # n0 より小さくなったら収束するに決まっている!
    end
    return nmax
end

using Plots
pyplot( scale=:log10, # 両対数軸で描く
        grid=false, tick_direction=:out, label="")
plot(   results[1:2:end],
        results[2:2:end],
        markershape=:circle)
plot!(  [1, limit],
        [1, limit^2],
        color=:orange)

コメント
  • X
  • Facebookでシェアする
  • はてなブックマークに追加する
  • LINEでシェアする

Julia に翻訳--228 2軸グラフ

2021年05月19日 | ブログラミング

#==========
Julia の修行をするときに,いろいろなプログラムを書き換えるのは有効な方法だ。
以下のプログラムを Julia に翻訳してみる。

2軸グラフ
https://oku.edu.mie-u.ac.jp/~okumura/python/2axis.html

ファイル名: .jl  関数名:

翻訳するときに書いたメモ

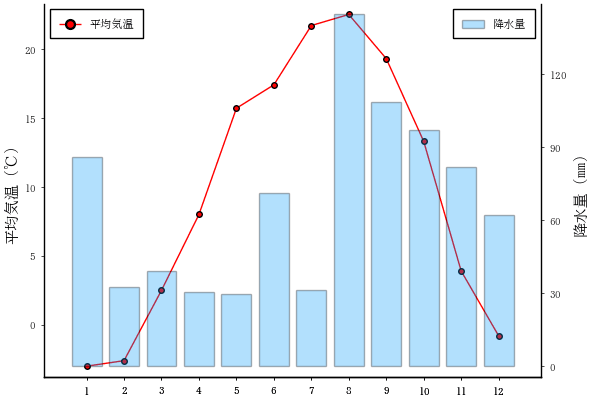
基礎は同じ pyplot なのだけど,Julia のほうが簡潔に書けるように見える。
当然,不必要な改行をしないで一行で書いても何の問題もない。

==========#

using Plots, Plots.PlotMeasures
kion = [-3.0, -2.6, 2.5, 8.0, 15.7, 17.4, 21.7, 22.5, 19.3, 13.3, 3.9, -0.8];
kousuiryou = [86.0, 32.5, 39.0, 30.5, 29.5, 71.0, 31.5, 144.5, 108.5, 97.0, 82.0, 62.0];
tsuki = 1:12
pyplot( grid=false,
        tick_direction=:out,
        xticks=1:12,
        right_margin=15mm)
plot(   tsuki,
        kion,
        markershape=:circle,
        color=:red,
        ylabel="平均気温(℃)",
        label="平均気温",
        legend=:topleft)
bar!(   twinx(),
        tsuki,
        kousuiryou,
        alpha=0.3,
        ylabel="降水量(mm)",
        label="降水量",
        legend=:topright)
savefig("twinaxis.png")

コメント
  • X
  • Facebookでシェアする
  • はてなブックマークに追加する
  • LINEでシェアする

Julia の小ネタ--025 QR 分解(結論)

2021年05月16日 | ブログラミング
結論から先に述べておく。

・ R の qr 分解には,デフォルトの LAPACK=FALSE と,LAPACK=TRUE がある。前者が unPivoted,後者が Pivoted。
・ 両者の結果はかなり違う。
・ Julia も両方に対応するそれぞれの関数が用意されている。デフォルトの Val(false) とVal(true) である。前者が Pivoted,後者が unPivoted。
・ R の qr 分解の結果を利用するいくつかの関数 qr.qy(), qr.qty() などがあるが,Julia では明示的に計算するだけである。
(実は,R のそれらの関数は裏で FORTRAN プログラムを利用しているのだが,単純な計算なのに読んでみると複雑怪奇)

特に指定がない限り unPiivoted QR decomposition を使えば良さそうだ。

以下の A, y について,QR 分解とそれに付随する計算を Juria と R で対比する。

A = [10 8 4
     10 3 3
      8 8 2
      3 5 9
      6 4 5]

y = [7.65
     5.88
     4.10
     2.36
     2.91]

R での Pivoted QR 分解は,LAPACK=TRUE を指定する。

R"QR2 = qr($A, LAPACK=TRUE)" # R での QR 分解の結果を QR2 に代入しておく
#=====
$qr
            [,1]       [,2]        [,3]
[1,] -17.5783958 -8.1349858 -12.1171466
[2,]   0.3626027  8.2959030   2.8239463
[3,]   0.2900821  0.1567791  -4.8166466
[4,]   0.1087808 -0.7920671  -0.3490988
[5,]   0.2175616 -0.2433863  -0.2604971

$rank
[1] 3

$qraux
[1] 1.568880 1.168779 1.681055

$pivot
[1] 1 3 2

attr(,"useLAPACK")
[1] TRUE
attr(,"class")
[1] "qr"
=====#

Julia での Pivoted QR 分解は,Val(true) を指定する。

QR = qr(A, Val(true));
QR
#=====
QRPivoted{Float64, Matrix{Float64}}
Q factor:
5×5 LinearAlgebra.QRPackedQ{Float64, Matrix{Float64}}:
 -0.56888   -0.0756797  -0.274156  -0.597487  -0.48836
 -0.56888   -0.196221    0.693239   0.36842   -0.146832
 -0.455104  -0.205194   -0.636312   0.505261   0.300988
 -0.170664   0.917519   -0.070799   0.26672   -0.229957
 -0.341328   0.268       0.185345  -0.425262   0.772315
R factor:
3×3 Matrix{Float64}:
 -17.5784  -8.13499  -12.1171
   0.0      8.2959     2.82395
   0.0      0.0       -4.81665
permutation:
3-element Vector{Int64}:
 1
 3
 2
=====#

Q,R 要素は個別に取り出せる。

QR.Q
#=====
5×5 LinearAlgebra.QRPackedQ{Float64, Matrix{Float64}}:
 -0.56888   -0.0756797  -0.274156  -0.597487  -0.48836
 -0.56888   -0.196221    0.693239   0.36842   -0.146832
 -0.455104  -0.205194   -0.636312   0.505261   0.300988
 -0.170664   0.917519   -0.070799   0.26672   -0.229957
 -0.341328   0.268       0.185345  -0.425262   0.772315
=====#

Q 要素は LinearAlgebra.QRPackedQ{Float64, Matrix{Float64}} なので,普通の行列にする必要がある場合には Matrix() を使う。

Matrix(QR.Q)
#=====
5×3 Matrix{Float64}:
 -0.56888   -0.0756797  -0.274156
 -0.56888   -0.196221    0.693239
 -0.455104  -0.205194   -0.636312
 -0.170664   0.917519   -0.070799
 -0.341328   0.268       0.185345
=====#

QR.R
#=====
3×3 Matrix{Float64}:
 -17.5784  -8.13499  -12.1171
   0.0      8.2959     2.82395
   0.0      0.0       -4.81665
=====#

R 要素は普通の Matrix{Float64} である。

R と Julia の結果を比較すると,R の $qr 要素の上三角行列が Julia の .R に対応している。それ以外は似ても似つかぬというところか。

QR 分解は色々な目的で使われる。R では,qr.coef(), qr.qy(),  qr.qty(), qr.resid(), qr.fitted(), qr.solve() がある。

まず,R のそれぞれの関数の結果が,Julia でどのように計算できるかを示す。

R"qr.qy(QR2, $y)" # QR2 は,前述の R での QR 分解の結果
#=====
           [,1]
[1,] -8.7521665
[2,] -2.2212452
[3,] -5.2286747
[4,]  3.7594407
[5,]  0.9684106
=====#

Julia では以下のようにする。

QR.Q * y
#=====
5-element Vector{Float64}:
 -8.752166455226726
 -2.221245180668157
 -5.228674673737823
  3.759440684122533
  0.968410597907452
=====#

R"qr.qty(QR2, y)"
#=====
            [,1]
[1,] -10.9589067
[2,]   0.3712013
[3,]  -0.2576622
[4,]  -0.9409527
[5,]  -1.6605395
=====#
Julia では以下のようにする。 
QR.Q' * y
#=====
5-element Vector{Float64}:
 -10.958906708515896
   0.3712012834183269
  -0.2576622285703076
  -0.9409527247136643
  -1.6605395228828508
=====#

QR.Q' * y と QR.Q \ y は同じである。

QR.Q \ y
#=====
5-element Vector{Float64}:
 -10.958906708515896
   0.3712012834183275
  -0.25766222857030807
  -0.9409527247136651
  -1.660539522882851
=====#

A * coef = y を解く。

R"qr.solve($A, $y)" # QR 分解をして方程式を解くことを明示的に要求している
# [1] 0.57427561 0.05349411 0.02653560

R"qr.coef(QR2, $y)" # qr.solve() と同じ
# [1] 0.57427561 0.05349411 0.02653560

R"lm(y ~ A + 0)$coefficients" # 定数項なしの重回帰分析と同じことである
#         A1         A2         A3
# 0.57427561 0.05349411 0.02653560

Julia では以下のようにする。 単純だA \ y # Julia が最適と判断した方法で解を求めている
#=====
3-element Vector{Float64}:
 0.5742756089206342
 0.05349411094648444
 0.026535602880579313
=====#

qr.fitted(), qr.resid() は LAPAC=TRUE の QR 分解の結果からは求められない。

R"qr.fitted(QR2, $y)" # not supported for LAPACK QR
R"qr.resid(QR2, $y)" # not supported for LAPACK QR


############################################################

R における unPivoted QR 分解は,LAPACK=FALSE を指定する(デフォルト)。

R"QR3 = qr($A, LAPACK=FALSE)" # R での QR 分解の結果を QR3 に代入しておく
#=====
RObject{VecSxp}
$qr
            [,1]         [,2]       [,3]
[1,] -17.5783958 -12.11714664 -8.1349858
[2,]   0.5688801   5.58343597  4.1958365
[3,]   0.4551041  -0.38764215  7.1566027
[4,]   0.1706640  -0.50356818 -0.8505587
[5,]   0.3413281   0.06747076 -0.3595714

$rank
[1] 3

$qraux
[1] 1.568880 1.769156 1.383743

$pivot
[1] 1 2 3

attr(,"class")
[1] "qr"
=====#

unPivoted なので,$pivot 要素は 1, 2, 3 のように昇順となる。

Julia では,unPivoted QR のために Val(false) を指定する(デフォルト)。

QR = qr(A, Val(false))
#=====
LinearAlgebra.QRCompactWY{Float64, Matrix{Float64}}
Q factor:
5×5 LinearAlgebra.QRCompactWYQ{Float64, Matrix{Float64}}:
 -0.56888    0.198228   -0.203947  -0.64671   -0.421014
 -0.56888   -0.697277    0.181347   0.350418  -0.185742
 -0.455104   0.445145   -0.498843   0.534798   0.244691
 -0.170664   0.525132    0.755705   0.24034   -0.257403
 -0.341328  -0.0243439   0.324937  -0.339413   0.813706
R factor:
3×3 Matrix{Float64}:
 -17.5784  -12.1171   -8.13499
   0.0       5.58344   4.19584
   0.0       0.0       7.1566
=====#

R での $qr 要素の上三角行列が Julia の .R に対応している

R のいくつかの関数の結果が Julia でどのように計算できるかを示す。

R"qr.qy(QR3, $y)" # QR3 は R での QR 分解の結果
# [1] -6.7739172 -7.4219216 -0.9351772  4.6987444  0.1448075
Julia ではこうなる。
QR.Q * y
#=====
5-element Vector{Float64}:
 -6.773917239743266
 -7.421921643467008
 -0.9351771532583504
  4.698744389504694
  0.14480746343604878
=====#

R"qr.qty(QR3, y)"
# [1] -10.9589067   0.4100200   0.1899048  -1.1146946  -1.5492706

Julia ではこうなる。
QR.Q' * y
#=====
5-element Vector{Float64}:
 -10.958906708515896
   0.4100199946407921
   0.18990476781269594
  -1.1146946162626405
  -1.5492706186064318
=====#

QR.Q' * y と QR.Q \ y は同じである。

QR.Q \ y
#=====
5-element Vector{Float64}:
 -10.958906708515896
   0.41001999464079364
   0.18990476781269755
  -1.1146946162626423
  -1.5492706186064322
=====#
回帰係数を求めるとき。
A * coef = y を解くのは,LAPACK=TRUE のときと同じである。

R"qr.solve($A, $y)" # QR 分解をして方程式を解くことを明示的に要求している
# [1] 0.57427561 0.05349411 0.02653560

R"qr.coef(QR3, $y)" # qr.solve() と同じ
# [1] 0.57427561 0.05349411 0.02653560

R"lm($y ~ $A + 0)$coefficients" # 定数項なしの重回帰分析と同じことである
#   `#JL`$A1   `#JL`$A2   `#JL`$A3
# 0.57427561 0.05349411 0.02653560
Julia での回帰係数
A \ y # Julia が最適と判断した方法で解を求めている
#=====
3-element Vector{Float64}:
 0.5742756089206342
 0.05349411094648444
 0.026535602880579313
=====#
予測値と残差の計算
R"qr.fitted(QR3, $y)" # LAPACK=TRUE の QR 分解では求まらなかった
# [1] 6.276851 5.982845 5.075229 2.229118 3.792308

R"qr.resid(QR3, $y)" # LAPACK=TRUE の QR 分解では求まらなかった
# [1]  1.3731486 -0.1028452 -0.9752290  0.1308822 -0.8823081

それぞれ,重回帰分析 lm($y ~ $A + 0) による予測値と残差である。

R"""
res = lm($y ~ $A + 0)
print(fitted(res))
print(resid(res))
"""
# fitted(res)
#        1        2        3        4        5
# 6.276851 5.982845 5.075229 2.229118 3.792308
# resid(res)
#         1          2          3          4          5
# 1.3731486 -0.1028452 -0.9752290  0.1308822 -0.8823081
Julia での予測値
A * (A \ y)
#=====
5-element Vector{Float64}:
 6.276851388300535
 5.982845230687532
 5.075228964698108
 2.229117807419539
 3.79230811171264
=====#
Julia での残差
y .- A * (A \ y)
#=====
5-element Vector{Float64}:
  1.3731486116994658
 -0.10284523068753249
 -0.9752289646981085
  0.13088219258046108
 -0.8823081117126397
 =====#
コメント
  • X
  • Facebookでシェアする
  • はてなブックマークに追加する
  • LINEでシェアする

シーザー暗号の解読--その2

2021年05月15日 | ブログラミング

定石的なプログラム?でもって,以下を解読せよ。

sh jpbkhk kl Mhkypk lzaá zpabhkh lu ls jluayv kl sh wluíuzbsh piéypjh. lz sh jhwpahs kl lzwhñh f aplul aylz tpssvulz kl ohipahualz. jbluah ahuav jvu ihyypvz huapnbvz, kvukl zl thuaplulu svz lkpmpjpvz opzaóypjvz f ayhkpjpvuhslz, jvtv jvu ihyypvz ublcvz, xbl zvu tbf hupthkvz wvy zly ls jluayv wvsíapjv f ljvuótpjv. v zlh, lz buh jpbkhk abyízapjh kvukl jvucpclu sv jbsabyhs f sv kpclyapkv. hkltáz, ohf chypvz tbzlvz xbl zhapzmhjlu h tpssvulz kl abypzahz xbl cpzpahu lzah jpbkhk.

ヒントは,スクロールして


英文ではない

解答はもっとスクロールして


スペイン語でした

la ciudad de Madrid está situada en el centro de la península ibérica. es la capital de españa y tiene tres millones de habitantes. cuenta tanto con barrios antiguos, donde se mantienen los edificios históricos y tradicionales, como con barrios nuevos, que son muy animados por ser el centro político y económico. o sea, es una ciudad turística donde conviven lo cultural y lo divertido. además, hay varios museos que satisfacen a millones de turistas que visitan esta ciudad.


コメント
  • X
  • Facebookでシェアする
  • はてなブックマークに追加する
  • LINEでシェアする

シーザー暗号の解読

2021年05月15日 | ブログラミング

シーザー暗号
https://oku.edu.mie-u.ac.jp/~okumura/python/gettysburg.html

cryptogram = """pyeb cmybo kxn cofox iokbc kqy yeb pkdrobc lbyeqrd pybdr yx drsc
    myxdsxoxd, k xog xkdsyx, myxmosfon sx vslobdi, kxn nonsmkdon dy dro
    zbyzycsdsyx drkd kvv wox kbo mbokdon oaekv.

    xyg go kbo oxqkqon sx k qbokd msfsv gkb, docdsxq grodrob drkd xkdsyx,
    yb kxi xkdsyx cy myxmosfon kxn cy nonsmkdon, mkx vyxq oxnebo. go kbo
    wod yx k qbokd lkddvo-psovn yp drkd gkb. go rkfo mywo dy nonsmkdo k
    zybdsyx yp drkd psovn, kc k psxkv bocdsxq zvkmo pyb dryco gry robo
    qkfo drosb vsfoc drkd drkd xkdsyx wsqrd vsfo. sd sc kvdyqodrob psddsxq
    kxn zbyzob drkd go cryevn ny drsc.

    led, sx k vkbqob coxco, go mkx xyd nonsmkdo -- go mkx xyd myxcombkdo
    -- go mkx xyd rkvvyg -- drsc qbyexn. dro lbkfo wox, vsfsxq kxn nokn,
    gry cdbeqqvon robo, rkfo myxcombkdon sd, pkb klyfo yeb zyyb zygob dy
    knn yb nodbkmd. dro gybvn gsvv vsddvo xydo, xyb vyxq bowowlob grkd go
    cki robo, led sd mkx xofob pybqod grkd droi nsn robo. sd sc pyb ec dro
    vsfsxq, bkdrob, dy lo nonsmkdon robo dy dro expsxscron gybu grsmr droi
    gry pyeqrd robo rkfo drec pkb cy xylvi knfkxmon. sd sc bkdrob pyb ec
    dy lo robo nonsmkdon dy dro qbokd dkcu bowksxsxq lopybo ec -- drkd
    pbyw droco ryxybon nokn go dkuo sxmbokcon nofydsyx dy drkd mkeco pyb
    grsmr droi qkfo dro vkcd pevv wokcebo yp nofydsyx -- drkd go robo
    rsqrvi bocyvfo drkd droco nokn crkvv xyd rkfo nson sx fksx -- drkd
    drsc xkdsyx, exnob qyn, crkvv rkfo k xog lsbdr yp pboonyw -- kxn drkd
    qyfobxwoxd yp dro zoyzvo, li dro zoyzvo, pyb dro zoyzvo, crkvv xyd
    zobscr pbyw dro okbdr."""

「平文に直せ」というプログラムをいかに書くかという問題の解説

シーザー暗号がどういうものであるか(特定の文字を、それよりも辞書順に特定の数だけ後ろ(または前)にある文字と置き換える)がわかっていれば,そして平文が我々の未知の言語ではないと仮定できるなら,ブルートフォースで解くのが簡単だ。

平文は長くなくてもよい(長くしているのは,文字頻度を調べるためにすぎない)ので,冒頭だけを取り上げる。

cryptogram = """pyeb cmybo kxn cofox iokbc kqy yeb pkdrobc lbyeqrd pybdr yx drsc
    myxdsxoxd, k xog xkdsyx, myxmosfon sx vslobdi, kxn nonsmkdon dy dro
    zbyzycsdsyx drkd kvv wox kbo mbokdon oaekv."""
    
c = Char[cryptogram...];

# c ="abcdefghijklmnopqrstuvwxyz" # プログラムのテスト用

以下を実行すれば,25 通りの解読例が出力されるので,ちらっと見ただけで,正解がわかる。

for i = 1:25
    text = ""
    for j in c
        code = Int(j) 
        if 'a' <= j <= 'z'
            code += i
            code = code > Int('z') ? code - Int('z') + Int('a') - 1 : code
        end
        text = text * string(Char(code))
    end
    println("$i: $text\n")
end

#=====
  :
15: entq rbnqd zmc rdudm xdzqr zfn ntq ezsgdqr aqntfgs enqsg nm sghr
bnmshmdms, z mdv mzshnm, bnmbdhudc hm khadqsx, zmc cdchbzsdc sn sgd
oqnonrhshnm sgzs zkk ldm zqd bqdzsdc dptzk.

16: four score and seven years ago our fathers brought forth on this
continent, a new nation, conceived in liberty, and dedicated to the
proposition that all men are created equal.

17: gpvs tdpsf boe tfwfo zfbst bhp pvs gbuifst cspvhiu gpsui po uijt
dpoujofou, b ofx obujpo, dpodfjwfe jo mjcfsuz, boe efejdbufe up uif
qspqptjujpo uibu bmm nfo bsf dsfbufe frvbm.
  :
=====#

コメント
  • X
  • Facebookでシェアする
  • はてなブックマークに追加する
  • LINEでシェアする

Julia の小ネタ--024 QR 分解

2021年05月14日 | ブログラミング

R での QR 分解は qr(x, LAPACK=TRUE), qr(x, LAPACK=FALSE) がある(後者がデフォルト,すなわち  qr(x))
R factor を取り出すには,qr.R() がある。

Julia でも同じ関数名なのだが,特別な引数はない。
qr(x) とした場合には Q factor, R factor の2要素が返される。

ここで混乱が始まる。しかるべく取り出した R の R factor と Julia の R factor が違う。

R の qr(x, LAPACK=TRUE)  は,Julia の LAPACK.geqp3!(x) に対応する。   pivoted QR decomposition
R の qr(x, LAPACK=FALSE) は,Julia の LAPACK.geqrf!(x) に対応する。 unpivoted QR decomposition

Julia の qr(x) の結果の R factor は qr.R(qr(x)) と同じである。

=====#

using LinearAlgebra, RCall

function qrR(R, complete = false)
    mn = minimum(size(R))
    !complete && (R = R[1:mn, :])
    [R[i, j] = 0 for i = 1:mn, j = 1:mn if i > j]
    R
end

★★ pivotted

a1 = reshape([1.,3,2,1,2,3,4,3,2,5,4,3], 4, :);
LAPACK.geqp3!(a1); # pivoted QR decomposition
qrR(a1) # LAPACK.geqp3!() の引数は破壊される
#=====
3×3 Matrix{Float64}:
 -7.34847  -5.98764  -3.81032
  0.0       1.46566  -0.555939
  0.0       0.0      -0.415227
=====#

R"""
a1 = matrix(c(1.0,3,2,1,2,3,4,3,2,5,4,3), 4)
res = qr(a1, LAPACK = TRUE)
print(qr.R(res));
"""
#=====
          [,1]      [,2]       [,3]
[1,] -7.348469 -5.987642 -3.8103174
[2,]  0.000000  1.465656 -0.5559386
[3,]  0.000000  0.000000 -0.4152274
=====#

★★ unpivotted

a1 = reshape([1.,3,2,1,2,3,4,3,2,5,4,3], 4, :);
LAPACK.geqrf!(a1); # unpivoted QR decomposition
qrR(a1) # LAPACK.geqrf!() の引数は破壊される
#=====
3×3 Matrix{Float64}:
 -3.87298  -5.68038  -7.22957
  0.0       2.39444   1.22506
  0.0       0.0       0.482243
=====#

R"""
a1 = matrix(c(1.0,3,2,1,2,3,4,3,2,5,4,3), 4)
res2 = qr(a1, LAPACK = FALSE)
print(qr.R(res2))
"""
#=====
          [,1]      [,2]       [,3]
[1,] -3.872983 -5.680376 -7.2295689
[2,]  0.000000  2.394438  1.2250613
[3,]  0.000000  0.000000  0.4822428
=====#

qr(a1)
#=====
LinearAlgebra.QRCompactWY{Float64, Matrix{Float64}}
Q factor:
4×4 LinearAlgebra.QRCompactWYQ{Float64, Matrix{Float64}}:
 -0.258199   0.222738  -0.289346  -0.894427
 -0.774597  -0.584688   0.241121   5.55112e-16
 -0.516398   0.445477  -0.578691   0.447214
 -0.258199   0.640373   0.723364   2.10942e-15
R factor:
3×3 Matrix{Float64}:
 -3.87298  -5.68038  -7.22957
  0.0       2.39444   1.22506
  0.0       0.0       0.482243
=====#
 

コメント
  • X
  • Facebookでシェアする
  • はてなブックマークに追加する
  • LINEでシェアする

Julia に翻訳--227 C 曲線

2021年05月13日 | ブログラミング

#==========
Julia の修行をするときに,いろいろなプログラムを書き換えるのは有効な方法だ。
以下のプログラムを Julia に翻訳してみる。

C 曲線
https://blog.goo.ne.jp/r-de-r/e/f5aa8e4436033d181824365a32640b91

ファイル名: drawC.jl  関数名:

翻訳するときに書いたメモ

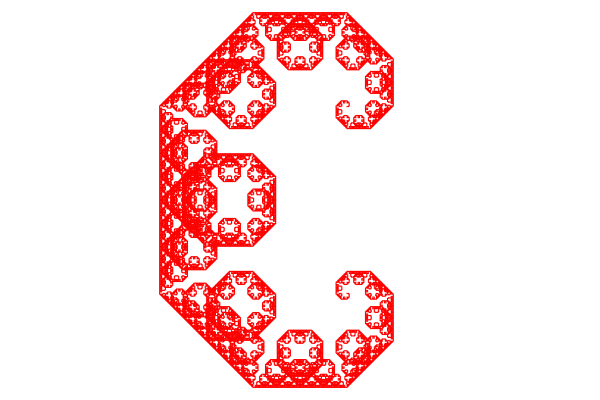
これも,奥村先生のプログラムを参考に書いたもののはず。アルゴリズム辞典の表紙に描いてあった。

R での実行を観察すると,線分を逐次描いている様子がわかる。しかしこれがネックで,DrawCmain1 はとてつもなく実行時間がかかる。
R ではさほどでもないのだが,Julia では,ハングアップしたかと思うほど。plot!() の呼出にコストが掛かっているのだ。

n が 1 増えると,実行時間は 4 倍くらいになるのかな。
そこで,線分の座標のみを蓄積して,最後に一度だけ plot!() するようにすれば爆速になった。
n = 13 のときには,2000 倍ということだ。

drawCmain1(0, 4, 0, -4, 11) #   7.971522
drawCmain1(0, 4, 0, -4, 12) #  33.294714
drawCmain1(0, 4, 0, -4, 13) # 159.953883

drawCmain2(0, 4, 0, -4, 11) #   0.049090
drawCmain2(0, 4, 0, -4, 12) #   0.063444
drawCmain2(0, 4, 0, -4, 13) #   0.081188 単位 sec.
==========#

using Plots

function drawCmain1(ax, ay, bx, by, n)
    function drawC(ax, ay, bx, by, n)
        x = bx-ax
        y = ay-by
        z = (x-y)/2
        cx = ax+z
        cy = by-z
        if n == 0
            plot!([ax, cx, bx], [ay, cy, by])
        else
            drawC(ax, ay, cx, cy, n-1)
            drawC(cx, cy, bx, by, n-1)
        end
    end

    gr(grid=false, showaxis=false, color=:red, ticks=false,
        aspect_ratio=1, label=false)
    plt = plot(xlims=(-8, 4), ylims=(-8, 8));
    drawC(ax, ay, bx, by, n) # 0, 4, 0, -4, 14
    savefig("drawc.png")
    display(plt)
end

drawCmain1(0, 4, 0, -4, 11)


using Plots

function drawCmain2(ax, ay, bx, by, n)
    function drawC(ax, ay, bx, by, n)
        x = bx-ax
        y = ay-by
        z = (x-y)/2
        cx = ax+z
        cy = by-z
        if n == 0
            append!(savedx, [ax, cx, bx])
            append!(savedy, [ay, cy, by])
        else
            drawC(ax, ay, cx, cy, n-1)
            drawC(cx, cy, bx, by, n-1)
        end
    end

    gr(grid=false, showaxis=false, color=:red, ticks=false,
        aspect_ratio=1, label=false)
    plt = plot(xlims=(-8, 4), ylims=(-8, 8));
    savedx = []
    savedy = []
    drawC(ax, ay, bx, by, n) # 0, 4, 0, -4, 14
    plot!(savedx, savedy)
    savefig("drawc.png")
    display(plt)
end

drawCmain2(0, 4, 0, -4, 15)

コメント
  • X
  • Facebookでシェアする
  • はてなブックマークに追加する
  • LINEでシェアする

Julia に翻訳--226 ドラゴンカーブ

2021年05月13日 | ブログラミング

#==========
Julia の修行をするときに,いろいろなプログラムを書き換えるのは有効な方法だ。
以下のプログラムを Julia に翻訳してみる。

奥村先生のページ
ドラゴンカーブを描く
https://oku.edu.mie-u.ac.jp/~okumura/python/dragoncurve.html

ファイル名: dragon.jl  関数名: maindragon

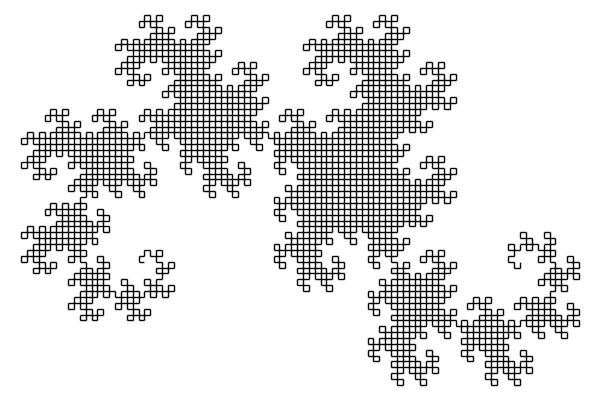
翻訳するときに書いたメモ

関数内の関数にすることで,global 宣言しなくてもよいことになる
ついでに,関数の引数で描画パラメータを関数の引数で与える

==========#

using Plots

function maindragon(i=10, dx=200, dy=0, sign=1)
    function dragon(i, dx, dy, sign)
        if i == 0
            plot!([x, x+dx], [y, y+dy])
            x += dx
            y += dy
        else
            dragon(i-1, (dx-sign*dy)/2, (dy+sign*dx)/2, 1)
            dragon(i-1, (dx+sign*dy)/2, (dy-sign*dx)/2, -1)
        end
    end

    pyplot(grid=false, showaxis=false, color=:black, ticks=false,
    aspect_ratio=1, label=false)
    x = y = 0
    plt = plot()
    dragon(i, dx, dy, sign)
    savefig("dragoncurve.png")
end

maindragon() # 10, 200, 0, 1
maindragon(12)

コメント
  • X
  • Facebookでシェアする
  • はてなブックマークに追加する
  • LINEでシェアする

Julia に翻訳--225 主成分回帰

2021年05月12日 | ブログラミング
#==========
Julia の修行をするときに,いろいろなプログラムを書き換えるのは有効な方法だ。
以下のプログラムを Julia に翻訳してみる。

名前 pls::svdpc.fit()

ファイル名: svdpcfit.jl  関数名: svdpcfit

翻訳するときに書いたメモ

特異値分解の関数で La.svd() が使われているが,Julia では svd() で問題ないようだ。
crossprod() も単純なことしかやっていないので,適切に行列演算をするだけだ。
変数名は変更した。

==========#

using Statistics, LinearAlgebra, NamedArrays

function svdpcfit(X, Y, ncomp; dnX = [], dnY = [], center = true, stripped = false)
  nobj, npred = size(X)
  nresp = size(Y, 2)
  length(dnX) == 0 && (dnX = ["X$i" for i = 1:npred])
  length(dnY) == 0 && (dnY = ["Y$i" for i = 1:nresp])
  (nresp == 1 && dnY[1] == "Y1") && (dnY[1] = "Y")
  coefficients = zeros(npred, nresp, ncomp);
  if !stripped
    fittedvalues = zeros(nobj, nresp, ncomp);
  end
  if center
    Xmeans = vec(mean(X, dims=1));
    X = (X' .- Xmeans)';
    Ymeans = vec(mean(Y, dims=1));
    Y = (Y' .- Ymeans)';
  else
    Xmeans = zeros(npred)
    Ymeans = zeros(nresp)
  end
  u, d, vt = svd(X);
  D = d[1:ncomp];
  scores = u[:, 1:ncomp] * diagm(D);
  loadings = vt[:, 1:ncomp];
  Xvar = D .^ 2;
  Xtotvar = sum(X .^ 2)
  tQ = (scores' * Y) ./ Xvar;
  Yloadings = transpose(tQ)
  for a = 1:ncomp
    coefficients[:, :, a] = loadings[:, 1:a] * tQ[1:a, :]
    if !stripped
      fittedvalues[:, :, a] = scores[:, 1:a] * tQ[1:a, :]
    end
  end
  if stripped
    Dict(:coefficients => coefficients, :Xmeans => Xmeans, :Ymeans => Ymeans)
  else
    residuals = Y .- fittedvalues;
    fittedvalues = Ymeans' .+ fittedvalues
    compnames = ["Comp $i" for i = 1:ncomp]
    nCompnames = ["$i comps" for i = 1:ncomp]
    Dict(:nobj => nobj, :npred => npred, :nresp => nresp,
         :dnX => dnX, :dnY => dnY, :ncomp => ncomp,
         :compnames => compnames, :nCompnames => nCompnames,
         :coefficients => coefficients, :scores => scores, :loadings => loadings,
         :Yloadings => Yloadings, :projection => loadings,
         :Xmeans => Xmeans, :Ymeans => Ymeans,
         :fittedvalues => fittedvalues, :residuals => residuals,
         :Xvar => Xvar, :Xtotvar => Xtotvar)
  end
end

function svdpcprint(obj)
  ncomp = obj[:ncomp]
  nobj = obj[:nobj]
  dnX = obj[:dnX]
  dnY = obj[:dnY]
  compnames = obj[:compnames]
  println("coefficients\n")
  for i = 1:ncomp
    println(", , $(obj[:nCompnames][i])\n",
      NamedArray(obj[:coefficients][:, :, i], (dnX, dnY)))
  end
  println("\nscores\n", NamedArray(obj[:scores], (1:nobj, compnames)))
  println("\nloadings\n", NamedArray(obj[:loadings], (dnX, compnames)))
  SSloadings = vec(sum(obj[:loadings] .^ 2, dims=1))
  ProportionVar = SSloadings ./ size(obj[:loadings], 1)
  CumulativeVar = cumsum(ProportionVar)
  println(NamedArray(hcat(SSloadings, ProportionVar, CumulativeVar)',
    (["SS loadings", "Proportion Var", "Cumulative Var"], compnames)))
  println("\nYloadings\n", NamedArray(obj[:Yloadings], (dnY, compnames)))
  SSloadings = vec(sum(obj[:Yloadings] .^ 2, dims=1))
  ProportionVar = SSloadings ./ size(obj[:Yloadings], 1)
  CumulativeVar = cumsum(ProportionVar)
  println(NamedArray(hcat(SSloadings, ProportionVar, CumulativeVar)',
    (["SS loadings", "Proportion Var", "Cumulative Var"], compnames)))
  println("\nprojection\n", NamedArray(obj[:projection], (dnX, compnames)))
  println("\nXmeans\n", NamedArray(reshape(obj[:Xmeans], 1, :), (["Xmeans"], dnX)))
  if obj[:nresp] == 1
    println("\nYmean\n", obj[:Ymeans][1])
  else
    println("\nYmeans\n", NamedArray(reshape(obj[:Ymeans], 1, :), (["Ymeans"], dnY)))
  end
  println("\nfitted values\n")
  for i = 1:ncomp
    println(", , $(obj[:nCompnames][i])\n",
      NamedArray(obj[:fittedvalues][:, :, i], (1:nobj, dnY)))
  end
  println("\nresiduals\n")
  for i = 1:ncomp
    println(", , $(obj[:nCompnames][i])\n",
      NamedArray(obj[:residuals][:, :, i], (1:nobj, dnY)))
  end
  println("\nXvar\n", NamedArray(reshape(obj[:Xvar], 1, :), (["Xvar"], compnames)))
  println("\nXtotvar = $(obj[:Xtotvar])")
end

X = [61.9  53.7  41.3  47.7  56.7
     70.5  47.2  53.5  48.1  40.8
     61.4  42.7  48.4  65.3  48.5
     54.6  42.8  73.3  18.6  48.8
     46.0  42.2  40.0  35.6  58.4
     43.4  40.2  50.7  52.2  45.0
     59.8  52.6  32.6  47.9  60.3
     49.2  45.3  41.2  62.9  39.4
     52.7  41.2  47.5  61.7  51.8
     48.1  52.8  58.1  50.3  77.7
     46.6  65.2  38.8  38.6  39.7
     41.6  32.2  46.6  54.3  47.0
     41.1  20.7  47.6  46.9  58.5
     53.3  57.8  65.3  44.5  20.8
     55.9  73.1  54.1  43.6  49.8];
Y = [43.3, 76.1, 64.2, 53.2, 62.8, 36.2, 66.9, 54.1,
     40.6, 62.8, 57.3, 46.0, 60.6, 42.7, 54.6];
obj = svdpcfit(X, Y, 3);
svdpcprint(obj)
#=====
coefficients

, , 1 comps
5×1 Named Matrix{Float64}
A ╲ B │          Y
──────┼───────────
X1    │ -0.0120428
X2    │ -0.0346016
X3    │  -0.019896
X4    │  0.0222783
X5    │  0.0279437
, , 2 comps
5×1 Named Matrix{Float64}
A ╲ B │          Y
──────┼───────────
X1    │ -0.0241079
X2    │ -0.0530765
X3    │ 0.00703593
X4    │ -0.0196489
X5    │  0.0524697
, , 3 comps
5×1 Named Matrix{Float64}
A ╲ B │          Y
──────┼───────────
X1    │  0.0381823
X2    │   0.145092
X3    │ -0.0978055
X4    │ -0.0585286
X5    │   0.281049

scores
15×3 Named Matrix{Float64}
A ╲ B │    Comp 1     Comp 2     Comp 3
──────┼────────────────────────────────
1     │ -0.347277    4.41909   -13.1949
2     │   9.79227    5.45379    4.10098
3     │  -7.78349    13.4306     3.5913
4     │   18.6041   -32.0181    7.03149
5     │  -7.50786   -10.9465   -6.27208
6     │   -5.3772   0.233441    10.1319
7     │  -6.56632    6.23862   -17.3912
8     │  -5.82498    17.0669    8.08649
9     │  -11.1815    7.73628    3.13631
10    │  -9.59517     -13.01   -18.9783
11    │   14.9809     6.6044   -7.27666
12    │  -14.1683  -0.102886    12.8477
13    │   -24.012   -14.1205    11.3212
14    │   28.6131     5.6228    18.2251
15    │   20.3738    3.39205   -15.3592

loadings
5×3 Named Matrix{Float64}
A ╲ B │    Comp 1     Comp 2     Comp 3
──────┼────────────────────────────────
X1    │  0.219312    0.20188  -0.189628
X2    │  0.630129   0.309135   -0.60328
X3    │  0.362326  -0.450645   0.319166
X4    │ -0.405709   0.701556    0.11836
X5    │ -0.508881  -0.410387  -0.695858
3×3 Named Adjoint{Float64, Matrix{Float64}}
         A ╲ B │ Comp 1  Comp 2  Comp 3
───────────────┼───────────────────────
SS loadings    │    1.0     1.0     1.0
Proportion Var │    0.2     0.2     0.2
Cumulative Var │    0.2     0.4     0.6

Yloadings
1×3 Named Transpose{Float64, Matrix{Float64}}
A ╲ B │     Comp 1      Comp 2      Comp 3
──────┼───────────────────────────────────
Y     │  -0.054912  -0.0597631   -0.328486
3×3 Named Adjoint{Float64, Matrix{Float64}}
         A ╲ B │     Comp 1      Comp 2      Comp 3
───────────────┼───────────────────────────────────
SS loadings    │ 0.00301533  0.00357163    0.107903
Proportion Var │ 0.00301533  0.00357163    0.107903
Cumulative Var │ 0.00301533  0.00658696     0.11449

projection
5×3 Named Matrix{Float64}
A ╲ B │    Comp 1     Comp 2     Comp 3
──────┼────────────────────────────────
X1    │  0.219312    0.20188  -0.189628
X2    │  0.630129   0.309135   -0.60328
X3    │  0.362326  -0.450645   0.319166
X4    │ -0.405709   0.701556    0.11836
X5    │ -0.508881  -0.410387  -0.695858

Xmeans
1×5 Named Matrix{Float64}
 A ╲ B │      X1       X2       X3       X4       X5
───────┼────────────────────────────────────────────
Xmeans │ 52.4067  47.3133  49.2667    47.88  49.5467

Ymean
54.760000000000005

fitted values

, , 1 comps
15×1 Named Matrix{Float64}
A ╲ B │       Y
──────┼────────
1     │ 54.7791
2     │ 54.2223
3     │ 55.1874
4     │ 53.7384
5     │ 55.1723
6     │ 55.0553
7     │ 55.1206
8     │ 55.0799
9     │  55.374
10    │ 55.2869
11    │ 53.9374
12    │  55.538
13    │ 56.0785
14    │ 53.1888
15    │ 53.6412
, , 2 comps
15×1 Named Matrix{Float64}
A ╲ B │       Y
──────┼────────
1     │  54.515
2     │ 53.8964
3     │ 54.3847
4     │ 55.6519
5     │ 55.8265
6     │ 55.0413
7     │ 54.7477
8     │ 54.0599
9     │ 54.9117
10    │ 56.0644
11    │ 53.5427
12    │ 55.5442
13    │ 56.9224
14    │ 52.8528
15    │ 53.4385
, , 3 comps
15×1 Named Matrix{Float64}
A ╲ B │       Y
──────┼────────
1     │ 58.8493
2     │ 52.5492
3     │ 53.2051
4     │ 53.3422
5     │ 57.8868
6     │ 51.7131
7     │ 60.4605
8     │ 51.4036
9     │ 53.8814
10    │ 62.2985
11    │ 55.9329
12    │ 51.3239
13    │ 53.2036
14    │ 46.8661
15    │ 58.4838

residuals

, , 1 comps
15×1 Named Matrix{Float64}
A ╲ B │         Y
──────┼──────────
1     │  -11.4791
2     │   21.8777
3     │   9.01259
4     │ -0.538414
5     │   7.62773
6     │  -18.8553
7     │   11.7794
8     │ -0.979861
9     │   -14.774
10    │   7.51311
11    │   3.36263
12    │  -9.53801
13    │   4.52145
14    │  -10.4888
15    │  0.958767
, , 2 comps
15×1 Named Matrix{Float64}
A ╲ B │        Y
──────┼─────────
1     │  -11.215
2     │  22.2036
3     │  9.81525
4     │ -2.45191
5     │  6.97353
6     │ -18.8413
7     │  12.1523
8     │ 0.040109
9     │ -14.3117
10    │  6.73559
11    │  3.75733
12    │ -9.54416
13    │  3.67757
14    │ -10.1528
15    │  1.16149
, , 3 comps
15×1 Named Matrix{Float64}
A ╲ B │         Y
──────┼──────────
1     │  -15.5493
2     │   23.5508
3     │   10.9949
4     │ -0.142171
5     │   4.91324
6     │  -15.5131
7     │   6.43952
8     │    2.6964
9     │  -13.2814
10    │  0.501486
11    │   1.36705
12    │  -5.32387
13    │   7.39641
14    │   -4.1661
15    │   -3.8838

Xvar
1×3 Named Matrix{Float64}
A ╲ B │  Comp 1   Comp 2   Comp 3
──────┼──────────────────────────
Xvar  │ 3117.67  2220.14  2047.35

Xtotvar = 9027.521333333332
=====#

Y2 = [ 46.0 58.3
      53.0 47.7
      58.2 66.4
      44.8 72.4
      45.2 41.8
      32.2 48.0
      50.8 53.9
      65.9 56.0
      61.6 49.7
      41.8 29.5
      55.2 48.1
      51.4 60.7
      60.5 45.1
      60.3 50.3
      47.5 43.0 ];
obj2 = svdpcfit(X, Y2, 3);
svdpcprint(obj2)
#=====
coefficients

, , 1 comps
5×2 Named Matrix{Float64}
A ╲ B │          Y1           Y2
──────┼─────────────────────────
X1    │ -0.00683921      0.01963
X2    │  -0.0196505    0.0564012
X3    │  -0.0112991    0.0324309
X4    │    0.012652    -0.036314
X5    │   0.0158694   -0.0455487
, , 2 comps
5×2 Named Matrix{Float64}
A ╲ B │         Y1          Y2
──────┼───────────────────────
X1    │  0.0597084   0.0233661
X2    │  0.0822523   0.0621222
X3    │  -0.159849   0.0240911
X4    │   0.243912  -0.0233308
X5    │   -0.11941  -0.0531434
, , 3 comps
5×2 Named Matrix{Float64}
A ╲ B │         Y1          Y2
──────┼───────────────────────
X1    │ 0.00973666   -0.042046
X2    │ -0.0767267   -0.145979
X3    │  -0.075741    0.134187
X4    │   0.275103   0.0174976
X5    │  -0.302786   -0.293179

scores
15×3 Named Matrix{Float64}
A ╲ B │    Comp 1     Comp 2     Comp 3
──────┼────────────────────────────────
1     │ -0.347277    4.41909   -13.1949
2     │   9.79227    5.45379    4.10098
3     │  -7.78349    13.4306     3.5913
4     │   18.6041   -32.0181    7.03149
5     │  -7.50786   -10.9465   -6.27208
6     │   -5.3772   0.233441    10.1319
7     │  -6.56632    6.23862   -17.3912
8     │  -5.82498    17.0669    8.08649
9     │  -11.1815    7.73628    3.13631
10    │  -9.59517     -13.01   -18.9783
11    │   14.9809     6.6044   -7.27666
12    │  -14.1683  -0.102886    12.8477
13    │   -24.012   -14.1205    11.3212
14    │   28.6131     5.6228    18.2251
15    │   20.3738    3.39205   -15.3592

loadings
5×3 Named Matrix{Float64}
A ╲ B │    Comp 1     Comp 2     Comp 3
──────┼────────────────────────────────
X1    │  0.219312    0.20188  -0.189628
X2    │  0.630129   0.309135   -0.60328
X3    │  0.362326  -0.450645   0.319166
X4    │ -0.405709   0.701556    0.11836
X5    │ -0.508881  -0.410387  -0.695858
3×3 Named Adjoint{Float64, Matrix{Float64}}
         A ╲ B │ Comp 1  Comp 2  Comp 3
───────────────┼───────────────────────
SS loadings    │    1.0     1.0     1.0
Proportion Var │    0.2     0.2     0.2
Cumulative Var │    0.2     0.4     0.6

Yloadings
2×3 Named Transpose{Float64, Matrix{Float64}}
A ╲ B │     Comp 1      Comp 2      Comp 3
──────┼───────────────────────────────────
Y1    │ -0.0311849    0.329639    0.263525
Y2    │  0.0895075   0.0185063    0.344949
3×3 Named Adjoint{Float64, Matrix{Float64}}
         A ╲ B │     Comp 1      Comp 2      Comp 3
───────────────┼───────────────────────────────────
SS loadings    │ 0.00898409    0.109004    0.188435
Proportion Var │ 0.00449204    0.054502   0.0942176
Cumulative Var │ 0.00449204   0.0589941    0.153212

projection
5×3 Named Matrix{Float64}
A ╲ B │    Comp 1     Comp 2     Comp 3
──────┼────────────────────────────────
X1    │  0.219312    0.20188  -0.189628
X2    │  0.630129   0.309135   -0.60328
X3    │  0.362326  -0.450645   0.319166
X4    │ -0.405709   0.701556    0.11836
X5    │ -0.508881  -0.410387  -0.695858

Xmeans
1×5 Named Matrix{Float64}
 A ╲ B │      X1       X2       X3       X4       X5
───────┼────────────────────────────────────────────
Xmeans │ 52.4067  47.3133  49.2667    47.88  49.5467

Ymeans
1×2 Named Matrix{Float64}
 A ╲ B │      Y1       Y2
───────┼─────────────────
Ymeans │ 51.6267  51.3933

fitted values

, , 1 comps
15×2 Named Matrix{Float64}
A ╲ B │      Y1       Y2
──────┼─────────────────
1     │ 51.6375  51.3622
2     │ 51.3213  52.2698
3     │ 51.8694  50.6967
4     │ 51.0465  53.0585
5     │ 51.8608  50.7213
6     │ 51.7944   50.912
7     │ 51.8314  50.8056
8     │ 51.8083   50.872
9     │ 51.9754  50.3925
10    │ 51.9259  50.5345
11    │ 51.1595  52.7342
12    │ 52.0685  50.1252
13    │ 52.3755  49.2441
14    │ 50.7344  53.9544
15    │ 50.9913  53.2169
, , 2 comps
15×2 Named Matrix{Float64}
A ╲ B │      Y1       Y2
──────┼─────────────────
1     │ 53.0942   51.444
2     │ 53.1191  52.3707
3     │ 56.2967  50.9452
4     │ 40.4921   52.466
5     │ 48.2524  50.5187
6     │ 51.8713  50.9164
7     │ 53.8879  50.9211
8     │ 57.4342  51.1878
9     │ 54.5255  50.5357
10    │ 47.6373  50.2937
11    │ 53.3366  52.8565
12    │ 52.0346  50.1233
13    │ 47.7208  48.9828
14    │ 52.5879  54.0585
15    │ 52.1095  53.2797
, , 3 comps
15×2 Named Matrix{Float64}
A ╲ B │      Y1       Y2
──────┼─────────────────
1     │  49.617  46.8925
2     │ 54.1998  53.7854
3     │  57.243   52.184
4     │ 42.3451  54.8915
5     │ 46.5996  48.3552
6     │ 54.5413  54.4113
7     │ 49.3049   44.922
8     │ 59.5652  53.9772
9     │  55.352  51.6175
10    │  42.636  43.7472
11    │  51.419  50.3464
12    │ 55.4203  54.5551
13    │ 50.7042   52.888
14    │ 57.3906  60.3452
15    │ 48.0619  47.9816

residuals

, , 1 comps
15×2 Named Matrix{Float64}
A ╲ B │        Y1         Y2
──────┼─────────────────────
1     │   -5.6375    6.93775
2     │    1.6787   -4.56981
3     │   6.33061    15.7033
4     │   -6.2465    19.3415
5     │   -6.6608   -8.92132
6     │  -19.5944   -2.91203
7     │  -1.03144     3.0944
8     │   14.0917    5.12805
9     │   9.62464  -0.692502
10    │  -10.1259   -21.0345
11    │   4.04051   -4.63423
12    │ -0.668503    10.5748
13    │   8.12452   -4.14408
14    │   9.56563   -3.65442
15    │  -3.49131   -10.2169
, , 2 comps
15×2 Named Matrix{Float64}
A ╲ B │        Y1         Y2
──────┼─────────────────────
1     │   -7.0942    6.85597
2     │ -0.119074   -4.67074
3     │   1.90335    15.4548
4     │   4.30789     19.934
5     │   -3.0524   -8.71874
6     │  -19.6713   -2.91635
7     │  -3.08793    2.97895
8     │   8.46578     4.8122
9     │   7.07446  -0.835671
10    │  -5.83729   -20.7937
11    │   1.86344   -4.75645
12    │ -0.634588    10.5767
13    │   12.7792   -3.88276
14    │   7.71214   -3.75848
15    │  -4.60946   -10.2797
, , 3 comps
15×2 Named Matrix{Float64}
A ╲ B │        Y1         Y2
──────┼─────────────────────
1     │  -3.61703    11.4075
2     │  -1.19978   -6.08537
3     │  0.956954     14.216
4     │   2.45492    17.5085
5     │  -1.39956   -6.55519
6     │  -22.3413   -6.41134
7     │   1.49508    8.97803
8     │   6.33479    2.02277
9     │   6.24797   -1.91754
10    │ -0.836035   -14.2472
11    │   3.78102   -2.24638
12    │  -4.02027    6.14493
13    │   9.79578   -7.78799
14    │   2.90939   -10.0452
15    │ -0.561928   -4.98156

Xvar
1×3 Named Matrix{Float64}
A ╲ B │  Comp 1   Comp 2   Comp 3
──────┼──────────────────────────
Xvar  │ 3117.67  2220.14  2047.35

Xtotvar = 9027.521333333332
=====#
コメント
  • X
  • Facebookでシェアする
  • はてなブックマークに追加する
  • LINEでシェアする

Julia に翻訳--224 マンテル・ヘンツェル検定

2021年05月11日 | ブログラミング
#==========
Julia の修行をするときに,いろいろなプログラムを書き換えるのは有効な方法だ。
以下のプログラムを Julia に翻訳してみる。

R の mantelhaen.test()

ファイル名: mantelhaentest.jl  関数名: mantelhaentest

翻訳するときに書いたメモ

R では,exact = TRUE の場合の信頼区間の計算において,uniroot の tol がデフォルトのままの .Machine$double.eps^0.25 になっているので解の精度が不十分である。

Exact conditional test of independence in 2 x 2 x k tables

data:  x
S = 16, p-value = 0.03994490358127
alternative hypothesis: true common odds ratio is not equal to 1
95 percent confidence interval:
 1.07740143018898 529.83739902335230
sample estimates:
common odds ratio
10.36102408137496

.Machine$double.eps^0.25
[1] 0.0001220703125
なので,小数点以下3桁程度の精度しかない。(信頼区間の推定値としては十分であろうが)

tol = Machine$double.eps にすれば,Julia での解と同じになる。

Exact conditional test of independence in 2 x 2 x k tables

data:  x
S = 16, p-value = 0.03994490358127
alternative hypothesis: true common odds ratio is not equal to 1
95 percent confidence interval:
 1.077387763518033 531.512782889939672
sample estimates:
common odds ratio
10.36102408137498

なお,mantelhaen.test() 中の d2x2xk() は C によるプログラムを呼ぶことになっているが,以下のような計算をするだけのものである。

d2x2xk = function(K, m, n, t, d) {
  y = pmax(0, t - n)
  z = pmin(m, t)
  tmy = t - y
  mpn = m + n
  zmy = z - y
  tbl = matrix(0, K + 1, sum(zmy) + 1)
  pos = 0
  tbl[1, 1] = 1
  for (i in 1:K) {
    for (j in 1:(zmy[i]+1)) {
      u = dhyper(tmy[i] - j+1, t[i], mpn[i] - t[i], n[i])
      tbl[i + 1, j:(j + pos)] = tbl[i + 1, j:(j + pos)] + tbl[i, 1:(pos + 1)] * u
    }
    pos = pos + zmy[i]
  }
  return(tbl[K, ] / sum(tbl[K, ]))
}

==========#

using Match, Rmath, LinearAlgebra, Roots, Printf

function mantelhaentest(x, y = [], z = []; alternative = "twosided", correct = true, exact = false, conflevel = 0.95)
  if typeof(x) == Array{Int64, 3}
    any(size(x) .< 2) && error("each dimension in table must be >= 2")
  else
    length(y) == 0 && error("if 'x' is not an array, 'y' must be given")
    length(z) == 0 && error("if 'x' is not an array, 'z' must be given")
    any(diff([length(x), length(y), length(z)]) .!= 0) && error("'x', 'y', and 'z' must have the same length")
    levelsx, tblx = table(x)
    levelsy, tbly = table(y)
    (length(levelsx) < 2 || length(levelsy) < 2) && error("'x' and 'y' must have at least 2 levels")
    x = table(x, y, z)
  end
  any(sum(x, dims=[1, 2]) .< 2) && error("sample size in each stratum must be > 1")
  I, J, K = size(x)
  if I == 2 && J == 2
    words = (["not equal to", "less than", "greater than"][indexin([alternative], ["twosided", "less", "greater"])])[1]
    if !exact
      method = "Mantel-Haenszel chi-squared test with continuity correction"
      sx = reshape(sum(x, dims=2), I, K)
      sy = reshape(sum(x, dims=1), J, K)
      n = vec(sum(x, dims=[1, 2]))
      delta = sum(x[1, 1, :] .- sx[1, :] .* sy[1, :] ./ n)
      yates = correct && abs(delta) >= 0.5 ? 0.5 : 0
      denom = sum(vec(prod(vcat(sx, sy), dims=1)) ./ (n .^ 2 .* (n .- 1)))
      statistic = (abs(delta) - yates) ^ 2 / denom
      df = 1
      if alternative == "twosided"
        pvalue = pchisq(statistic, df, false)
      else
        z = sign(delta) * sqrt(statistic)
        pvalue = pnorm(z, alternative == "less")
      end
      sdiag = sum(x[1, 1, :] .* x[2, 2, :] ./ n)
      soffd = sum(x[1, 2, :] .* x[2, 1, :] ./ n)
      estimate = sdiag / soffd
      sd = sqrt(sum((x[1, 1, :] .+ x[2, 2, :]) .* x[1, 1, :] .* x[2, 2, :] ./ n .^ 2) /
               (2 * sdiag ^ 2) +
                sum(((x[1, 1, :] .+ x[2, 2, :]) .* x[1, 2, :] .* x[2, 1, :] +
               (x[1, 2, :] .+ x[2, 1, :]) .* x[1, 1, :] .* x[2, 2, :]) ./ n .^ 2) /
               (2 * sdiag * soffd) +
                sum((x[1, 2, :] .+ x[2, 1, :]) .* x[1, 2, :] .* x[2, 1, :] ./ n .^ 2) /
               (2 * soffd ^ 2))
      cint = @match alternative begin
                "less"     => [0, estimate * exp(qnorm(conflevel) * sd)]
                "greater"  => [estimate * exp(qnorm(conflevel, false) * sd), Inf]
                "twosided" => estimate .* exp.([1, -1] .* qnorm((1 - conflevel) / 2) * sd)
             end
      println(method)
      @printf("Mantel-Haenszel X-squared = %.5f,  df = %d,  p value = %.5f\n", statistic, df, pvalue)
      @printf("alternative hypothesis: true common odds ratio is %s 1\n", words)
      @printf("%g %% confidence interval: [%.6f, %.6f]\n", 100conflevel, cint[1], cint[2])
      @printf("sample estimates: common odds ratio %g", estimate)
      Dict(:statistic => statistic, :df => df, :pvalue => pvalue,
           :conflevel => conflevel, :cint => cint, :method => method)
    else
      function dn2x2xk(ncp)
        (length(ncp) == 1 && ncp == 1) && return dc
        d = logdc .+ log.(ncp) .* support
        d = exp.(d .- maximum(d))
        d ./ sum(d)
      end

      function mn2x2xk(ncp)
        ncp == 0 && return lo
        ncp == Inf && return hi
        sum(support .* dn2x2xk(ncp))
      end

      function pn2x2xk(q, ncp = 1; uppertail = false)
        if length(ncp) == 1 && ncp == 0
          uppertail ? float(q <= lo) : float(q >= lo)
        elseif length(ncp) == 1 && ncp == Inf
          uppertail ? float(q <= hi) : float(q >= hi)
        else
          d = dn2x2xk(ncp)
          if uppertail
            select = support .>= q
          else
            select = support .<= q
          end
          sum(d[select])
        end
      end

      function mle(x)
        x == lo && return 0
        x == hi && return Inf
        mu = mn2x2xk(1)
        if mu > x
          find_zero(t -> mn2x2xk(t) - x, (0, 1))
        elseif mu < x
          1 / find_zero(t -> mn2x2xk(1 / t) - x, (eps(), 1))
        else
          1
        end
      end

      function ncpU(x, alpha)
        x == hi && return Inf
        p = pn2x2xk(x, 1)
        if p < alpha
          find_zero(t -> pn2x2xk(x, t) - alpha, (0, 1))
        elseif p > alpha
          1 / find_zero(t -> pn2x2xk(x, 1 / t) - alpha, (eps(), 1))
        else
          1
        end
      end

      function ncpL(x, alpha)
        x == lo && return 0
        p = pn2x2xk(x, 1; uppertail = true)
        if p > alpha
          find_zero(t -> pn2x2xk(x, t, uppertail = true) - alpha, (0, 1))
        elseif p < alpha
          1 / find_zero(t -> pn2x2xk(x, 1 / t, uppertail = true) - alpha, (eps(), 1))
        else
          1
        end
      end

      method = "Exact conditional test of independence in 2 x 2 x k tables"
      mn = reshape(sum(x, dims=1), I, :)
      m = mn[1, :]
      n = mn[2, :]
      t = reshape(sum(x, dims= 2), J, :)[1, :]
      s = sum(x[1, 1, :])
      lo = sum(pmax(0, t - n))
      hi = sum(pmin(m, t))
      support = lo:hi
      dc = d2x2xk(K, m, n, t, hi - lo + 1)
      logdc = log.(dc)
      relErr = 1.0000001
      alpha2 = (1 - conflevel) / 2
      pvalue, cint = @match alternative begin
            "less" => (pn2x2xk(s, 1), [0, ncpU(s, 1 - conflevel)])
            "greater" => (pn2x2xk(s, 1, uppertail = true), [ncpL(s, 1 - conflevel), Inf])
            "twosided" => (sum(dc[dc .<= dc[s - lo + 1] * relErr]), [ncpL(s, alpha2), ncpU(s, alpha2)])
            end
      statistic = s
      estimate = mle(s)
      println(method)
      @printf("S = %g,  p value = %.5f\n", statistic, pvalue)
      @printf("alternative hypothesis: true common odds ratio is %s 1\n", words)
      @printf("%g %% confidence interval: [%.6f, %.6f]\n", 100conflevel, cint[1], cint[2])
      @printf("sample estimates: common odds ratio %g", estimate)
      Dict(:statistic => statistic, :pvalue => pvalue,
           :conflevel => conflevel, :cint => cint, :method => method)
    end
  else
    df = (I - 1) * (J - 1)
    n = zeros(df)
    m = zeros(df)
    V = zeros(df, df)
    for k = 1:K
      f = x[:, :, k]
      ntot = sum(f)
      rowsums = sum(f, dims=2)[1:I-1]
      colsums = sum(f, dims=1)[1:J-1]
      n .+= vec(f[1:I-1, 1:J-1])
      m .+= vec(rowsums .* colsums' ./ ntot)
      V .+= kron(
        diag(ntot .* colsums, J - 1) .- (colsums .* colsums'),
        diag(ntot .* rowsums, I - 1) .- (rowsums .* rowsums')) /
        (ntot ^ 2 * (ntot - 1))
    end
    n = n - m
    statistic = n' * (V \ n)
    df = df
    pvalue = pchisq(statistic, df, false)
    method = "Cochran-Mantel-Haenszel test"
    println(method)
    @printf("Cochran-Mantel-Haenszel M^2 = %.5f,  df = %d,  p value = %.6f\n", statistic, df, pvalue)
    Dict(:statistic => statistic, :df => df, :pvalue => pvalue, :method => method)
  end
end

function table(x) # indices が少ないとき
    indices = sort(unique(x))
    counts = zeros(Int, length(indices))
    for i in indexin(x, indices)
        counts[i] += 1
    end
    return indices, counts
end

function table(x, y, z) # 三次元
    indicesx = sort(unique(x))
    indicesy = sort(unique(y))
    indicesz = sort(unique(z))
    counts = zeros(Int, length(indicesx), length(indicesy), length(indicesz))
    for (i, j, k) in zip(indexin(x, indicesx), indexin(y, indicesy), indexin(z, indicesz))
        counts[i, j, k] += 1
    end
    return indicesx, indicesy, indicesz, counts
end

function diag(x, n)
  a = zeros(n, n)
  [a[i, i] = x[i] for i = 1:n]
  a
end

function adjustlength(x, y)
  if length(x) == 1
    x = fill(x, length(y))
  elseif length(y) == 1
    y = fill(y, length(x))
  end
  length(x) != length(y) && error("length(x) != length(y)")
  x, y
end

function pmin(x, y)
  x, y = adjustlength(x, y)
  [min(x0, y0) for (x0, y0) in zip(x, y)]
end

function pmax(x, y)
  x, y = adjustlength(x, y)
  [max(x0, y0) for (x0, y0) in zip(x, y)]
end

function d2x2xk(K, m, n, t, d)
  y = pmax(0, t - n)
  z = pmin(m, t)
  tmy = t - y
  mpn = m + n
  zmy = z - y
  tbl = zeros(K + 1, sum(zmy) + 1)
  pos = 0
  tbl[1, 1] = 1
  for i = 1:K
      for j = 1:zmy[i]+1
          u = dhyper(tmy[i] - j+1, t[i], mpn[i] - t[i], n[i])
          tbl[i + 1, j:j + pos] .+= tbl[i, 1:pos + 1] * u
      end
      pos += zmy[i]
  end
  tbl[K, :] / sum(tbl[K, :])
end

x = reshape([0, 0, 6, 5, 3, 0, 3, 6, 6, 2, 0, 4, 5, 6, 1, 0, 2,
    5, 0, 0], 2, 2, :);

mantelhaentest(x);
#=====
Mantel-Haenszel chi-squared test with continuity correction
Mantel-Haenszel X-squared = 3.92857,  df = 1,  p value = 0.04747
alternative hypothesis: true common odds ratio is not equal to 1
95 % confidence interval: [1.026713, 47.725133]
sample estimates: common odds ratio 7
=====#

using RCall
R"mantelhaen.test($x)"
#=====
	Mantel-Haenszel chi-squared test with continuity correction

data:  `#JL`$x
Mantel-Haenszel X-squared = 3.9286, df = 1, p-value = 0.04747
alternative hypothesis: true common odds ratio is not equal to 1
95 percent confidence interval:
  1.026713 47.725133
sample estimates:
common odds ratio
                7
=====#

mantelhaentest(x, alternative="less");
#=====
Mantel-Haenszel chi-squared test with continuity correction
Mantel-Haenszel X-squared = 3.92857,  df = 1,  p value = 0.97626
alternative hypothesis: true common odds ratio is less than 1
95 % confidence interval: [0.000000, 35.052454]
sample estimates: common odds ratio 7
=====#
R"mantelhaen.test($x, alternative=\"less\")"
#=====
	Mantel-Haenszel chi-squared test with continuity correction

data:  `#JL`$x
Mantel-Haenszel X-squared = 3.9286, df = 1, p-value = 0.9763
alternative hypothesis: true common odds ratio is less than 1
95 percent confidence interval:
  0.00000 35.05245
sample estimates:
common odds ratio
                7
=====#

mantelhaentest(x, alternative="greater");
#=====
Mantel-Haenszel chi-squared test with continuity correction
Mantel-Haenszel X-squared = 3.92857,  df = 1,  p value = 0.02374
alternative hypothesis: true common odds ratio is greater than 1
95 % confidence interval: [1.397905, Inf]
sample estimates: common odds ratio 7
=====#

R"mantelhaen.test($x, alternative=\"greater\")"
#=====
	Mantel-Haenszel chi-squared test with continuity correction

data:  `#JL`$x
Mantel-Haenszel X-squared = 3.9286, df = 1, p-value = 0.02374
alternative hypothesis: true common odds ratio is greater than 1
95 percent confidence interval:
 1.397905      Inf
sample estimates:
common odds ratio
                7
=====#

mantelhaentest(x, exact=true);
#=====
Exact conditional test of independence in 2 x 2 x k tables
S = 16,  p value = 0.03994
alternative hypothesis: true common odds ratio is not equal to 1
95 % confidence interval: [1.077388, 531.512783]
sample estimates: common odds ratio 10.361
=====#

R"mantelhaen.test($x, exact=TRUE)"
#=====
	Exact conditional test of independence in 2 x 2 x k tables

data:  `#JL`$x
S = 16, p-value = 0.03994
alternative hypothesis: true common odds ratio is not equal to 1
95 percent confidence interval:
   1.077401 529.837399
sample estimates:
common odds ratio
         10.36102
=====#

mantelhaentest(x, exact=true, alternative="less");
#=====
Exact conditional test of independence in 2 x 2 x k tables
S = 16,  p value =0.99862
alternative hypothesis: true common odds ratio is less than 1
95 % confidence interval: [0.000000, 261.487879]
sample estimates: common odds ratio 10.361
=====#
R"mantelhaen.test($x, exact=TRUE, alternative=\"less\")"
#=====
	Exact conditional test of independence in 2 x 2 x k tables

data:  `#JL`$x
S = 16, p-value = 0.9986
alternative hypothesis: true common odds ratio is less than 1
95 percent confidence interval:
   0.0000 262.2733
sample estimates:
common odds ratio
         10.36102
=====#

mantelhaentest(x, exact=true, alternative="greater");
#=====
Exact conditional test of independence in 2 x 2 x k tables
S = 16,  p value = 0.01997
alternative hypothesis: true common odds ratio is greater than 1
95 % confidence interval: [1.384222, Inf]
sample estimates: common odds ratio 10.361
=====#

R"mantelhaen.test($x, exact=TRUE, alternative=\"greater\")"
#=====
Exact conditional test of independence in 2 x 2 x k tables

data:  `#JL`$x
S = 16, p-value = 0.01997
alternative hypothesis: true common odds ratio is greater than 1
95 percent confidence interval:
1.384239      Inf
sample estimates:
common odds ratio
       10.36102
=====#

#####################################################################################

x = reshape([8, 3, 0, 3, 0, 2, 0, 3, 3, 5, 0, 3,
             2, 1, 2, 8, 2, 0, 2, 2, 0, 0, 1, 1,
             0, 1, 0, 8, 2, 1, 8, 8, 0, 5, 5, 8,
             0, 1, 0, 5, 2, 5, 1, 1, 2, 3, 3, 0,
             5, 0, 2, 0, 0, 2, 1, 2, 2, 1, 0, 1,
             5, 8, 1, 1, 0, 5, 0, 8, 1, 0, 5, 8], 3, 4, :)

mantelhaentest(x);
#=====
Cochran-Mantel-Haenszel test
Cochran-Mantel-Haenszel M^2 = 33.32493,  df = 6,  p value = 0.000009
=====#

R"mantelhaen.test($x)"
#=====
Cochran-Mantel-Haenszel test

data:  `#JL`$x
Cochran-Mantel-Haenszel M^2 = 33.325, df = 6, p-value = 9.079e-06
=====#
コメント
  • X
  • Facebookでシェアする
  • はてなブックマークに追加する
  • LINEでシェアする

Julia に翻訳--223 Shapiro-Wilk 検定,正規性の検定

2021年05月07日 | ブログラミング

Julia に翻訳--223 Shapiro-Wilk 検定,正規性の検定

#==========
Julia の修行をするときに,いろいろなプログラムを書き換えるのは有効な方法だ。
以下のプログラムを Julia に翻訳してみる。

algorithm as241  appl. statist. (1988) vol. 37, no. 3, 477- 484.
https://jblevins.org/mirror/amiller/as181.f90

ファイル名: shapirotest.jl  関数名: shapirotest

翻訳するときに書いたメモ

Julia に翻訳--220, 221, 222 は他ならず,これを翻訳するための道具であった。
alnorm, ppnd は名前をそのまま残し,pnorm, qnorm を使う。
alnorm(z, flag=true) = pnorm(z, flag)
ppnd(p) = qnorm(p)
途中,謎の数値がいくつかあるが,正確な記述に改めた。
結果として R の shapiro.test() と同じ精度の結果が得られる。(n = 3 のときのp値の末尾がちょっと違う)
その他,Julia の特徴を生かした簡潔なプログラムになったと思う。

==========#

using Statistics, Rmath

function shapirotest(x)
  x = sort(x);
  n = length(x)
  (n < 3 || n > 5000) && error("sample size must be between 3 and 5000")
  rng = x[n] - x[1]
  rng == 0 && ("all 'x' values are identical")
  rng < 1e-10 && (x ./= rng)
  # 仮定
  # 1. 打切りデータ,欠損値はない
  # 2. 3 <= n <= 5000
  # 3. データは昇順にソートされている
  # 4. 全て同じ値ということはない
  # 5. rng < 1e-10 のときは,事前に標準化されている
  swilk(x, n)
end

function swilk(x, n)
  #=====
           algorithm as r94 appl. statist. (1995) vol.44, no.4

           calculates the shapiro-wilk w test and its significance level

    input:
      x(n)    sample values in ascending order.
      n        the total sample size (including any right-censored values).
    output
      w        the shapiro-wilks w-statistic.
      pw       the p-value for w.
  =====#

  n2 = n ÷ 2

  # calculates coefficients for the test
  if n == 3
    # a = [0.70711]
    a = [1/sqrt(2)]
  else
    a = zeros(n2);
    an25 = n + 0.25
    a = [ppnd((i - 0.375) / an25) for i = 1:n2]
    summ2 = 2sum(a .^ 2)
    ssumm2 = sqrt(summ2)
    rsn = 1 / sqrt(n)
    c1 = [0.0, 0.221157, -0.147981, -2.07119, 4.434685, -2.706056]
    a1 = poly(c1, rsn) - a[1] / ssumm2

    # normalize coefficients
    if n > 5
      c2 = [0.0, 0.042981, -0.293762, -1.752461, 5.682633, -3.582633]
      a2 = -a[2] / ssumm2 + poly(c2, rsn)
      fac = sqrt((summ2 - 2 * a[1] ^ 2  - 2 * a[2] ^ 2) / (1 - 2 * a1 ^ 2 - 2 * a2 ^ 2))
      a[1] = a1
      a[2] = a2
      a[3:n2] ./= -fac
    else
      fac = sqrt((summ2 - 2 * a[1] ^ 2) / (1 - 2 * a1 ^ 2))
      a[1] = a1
      a[2:n2] ./= -fac
    end
  end

  # calculate w statistic as squared correlation between data and coefficients
  x ./= x[n] - x[1]
  x .-= mean(x)
  ssa = ssx = sax = 0
  for i = 1:n
    j = n + 1 - i
    asa = i == j ? 0 : sign(i - j) * a[min(i, j)]
    ssa += asa^2
    ssx += x[i]^2
    sax += asa * x[i]
  end

  # w1 equals (1-w) claculated to avoid excessive rounding error
  # for w very near 1 (a potential problem in very large samples)
  ssassx = sqrt(ssa * ssx)
  w1 = (ssassx - sax) * (ssassx + sax) / (ssa * ssx)
  w = 1 - w1

  # calculate significance level for w (exact for n=3)
  if n == 3
    # pw = 1.909859 * (asin(sqrt(w)) - 1.047198)
    pw = 6 / π * (asin(sqrt(w)) - π / 3)
  else
    y = log(w1)
    xx = log(n)
    m = 0
    s = 1
    if n <= 11
      gamma = poly([-2.273, 0.459], n)
      y >= gamma && return w, 1e-10
      y = -log(gamma - y)
      m = poly([0.5440, -0.39978, 0.025054, -0.6714e-3], n)
      s = exp(poly([1.3822, -0.77857, 0.062767, -0.0020322], an))
    else
      m = poly([-1.5861, -0.31082, -0.083751, 0.0038915], xx)
      s = exp(poly([-0.4803, -0.082676, 0.0030302], xx))
    end
    pw = alnorm((y - m) / s, false)
  end
  w, pw
end

function poly(coefficients, x)

  #        algorithm as 181.2   appl. statist.  (1982) vol. 31, no. 2

  #        calculates the algebraic polynomial of order nored-1 with
  #        array of coefficients coefficients.  zero order coefficient is coefficients[1]

  nord = length(coefficients)
  result = 0
  for i = nord:-1:2
    result = (result + coefficients[i]) * x
  end
  result + coefficients[1]
end

ppnd(p) = qnorm(p)
alnorm(z, flag=true) = pnorm(z, flag)

使用例

偶数個
x = [ 0.03, 0.08, 0.14, 0.14, 0.15, 0.17, 0.31, 0.37, 0.37, 0.40,
      0.42, 0.43, 0.49, 0.53, 0.60, 0.62, 0.72, 0.75, 0.87, 0.97 ];

奇数個
y = [ 0.03, 0.08, 0.14, 0.14, 0.15, 0.17, 0.31, 0.37, 0.37, 0.40,
      0.42, 0.43, 0.49, 0.53, 0.60, 0.62, 0.72, 0.75, 0.87 ];

最小個数
z = [ 0.03, 0.08, 0.14 ];

最大個数
using Random
Random.seed!(321)
u = randn(5000);

shapirotest(x) # (0.9594825287257593, 0.5335636425303667)
shapirotest(y) # (0.9607205920932019, 0.5866579913499355)
shapirotest(z) # (0.9972527472527474, 0.8998502800372317)
shapirotest(u) # (0.9995093332208211, 0.22746134654936953)

R の shapiro.test() の結果と比較
using RCall
R"""
options(digits=16)
a = shapiro.test($x); cat(a$statistic, a$p.value,"\n")
b = shapiro.test($y); cat(b$statistic, b$p.value,"\n")
c = shapiro.test($z); cat(c$statistic, c$p.value,"\n")
d = shapiro.test($u); cat(d$statistic, d$p.value,"\n")
"""
# 0.9594825287257593 0.5335636425303667
# 0.9607205920932019 0.5866579913499355
# 0.9972527472527474 0.8998502800372251
# 0.9995093332208211 0.2274613465493695

コメント
  • X
  • Facebookでシェアする
  • はてなブックマークに追加する
  • LINEでシェアする

Julia に翻訳--222 多項式の値を求める

2021年05月07日 | ブログラミング

Julia に翻訳--222 多項式の値を求める

#==========
Julia の修行をするときに,いろいろなプログラムを書き換えるのは有効な方法だ。
以下のプログラムを Julia に翻訳してみる。

algorithm as241  appl. statist. (1988) vol. 37, no. 3, 477- 484.
https://jblevins.org/mirror/amiller/as181.f90

ファイル名: poly.jl  関数名: poly

翻訳するときに書いたメモ

元は FORTRAN プログラム。書き方も古風なので(GO TO があったり),少し新しめに。

==========#

function poly(coefficients, x)

  #        algorithm as 181.2   appl. statist.  (1982) vol. 31, no. 2

  #        calculates the algebraic polynomial of order nored-1 with
  #        array of coefficients coefficients.  zero order coefficient is coefficients[1]

  nord = length(coefficients)
  result = coefficients[1]
  nord == 1 && return result
  p = x * coefficients[nord]
  if nord != 2
    n2 = nord - 2
    j = n2 + 1
    for i = 1:n2
      p = (p + coefficients[j]) * x
      j -= 1
    end
  end
  result + p
end

元のプログラムは古い FORTRAN で書かれているので,もっとわかりにくいが,書き換えてもなお,
プログラムが長く,一見何をやっているかわかりづらいが,nord が 1 であるかとか,2 であるとか,定数項を特別扱いしたりとかしなくてもよい。
たとえば,以下の5次式
0.1 + 0.221157∙x - 0.147981∙x^2 - 2.07119∙x^3 + 4.434685∙x^4 - 2.706056∙x^5
を ^ を使わないで
((((-2.706056∙x + 4.434685)∙x - 2.07119)∙x - 0.147981)∙x + 0.221157)∙x + 0.1
として計算する。

以下のように,短く簡潔でわかりやすいプログラムになる。

function poly2(coefficients, x)

  #        algorithm as 181.2   appl. statist.  (1982) vol. 31, no. 2

  #        calculates the algebraic polynomial of order nored-1 with
  #        array of coefficients coefficients.  zero order coefficient is coefficients[1]

  nord = length(coefficients)
  result = 0
  for i = nord:-1:2
    result = (result + coefficients[i]) * x
  end
  result + coefficients[1]
end

c6 = [0.1, 0.221157, -0.147981, -2.07119, 4.434685, -2.706056];
# 0.1 + 0.221157∙x - 0.147981∙x^2 - 2.07119∙x^3 + 4.434685∙x^4 - 2.706056∙x^5
# ((((-2.706056∙x + 4.434685)∙x - 2.07119)∙x - 0.147981)∙x + 0.221157)∙x + 0.1 これを計算する

x = 1.2
poly(c6, x)  # -0.9644910099199991
poly2(c6, x) # -0.9644910099199991

Julia では以下のようにすればよい。
using Polynomials
func = Polynomial(c6)
typeof(func) # Polynomial{Float64, :x}; func は関数
func(x)      # -0.9644910099199991

2次式,1次式,0次式の場合もちゃんと動くのを確認しておく。

c3 = [1.2, 3.4, 5.6]; # (5.6∙x + 3.4)∙x + 1.2
poly(c3, 3)       # 61.79999999999999
poly2(c3, 3)      # 61.79999999999999
Polynomial(c3)(3) # 61.79999999999999

c2 = [1.2, 3.4]; # 3.4∙x + 1.2
poly(c2, 3)       # 11.399999999999999
poly2(c2, 3)      # 11.399999999999999
Polynomial(c2)(3) # 11.399999999999999

c1 = [1.2]; # 1.2; x に何を指定しても無関係(定数が返される)
poly(c1, 5)       # 1.2
poly2(c1, 5)      # 1.2
Polynomial(c1)(5) # 1.2

コメント
  • X
  • Facebookでシェアする
  • はてなブックマークに追加する
  • LINEでシェアする

Julia に翻訳--221 alnorm,正規分布の確率(1.96 を与えると 0.975 を返すような)

2021年05月07日 | ブログラミング

#==========
Julia の修行をするときに,いろいろなプログラムを書き換えるのは有効な方法だ。
以下のプログラムを Julia に翻訳してみる。

algorithm as241  appl. statist. (1988) vol. 37, no. 3, 477- 484.
https://jblevins.org/mirror/amiller/as181.f90

ファイル名: alnorm.jl  関数名: alnorm

翻訳するときに書いたメモ

元は FORTRAN プログラム。書き方も古風なので(GO TO があったり),少し新しめに。

==========#

function alnorm(z, lower=true)

    #=====
       algorithm as66 applied statistics (1973) vol.22, no.3

       evaluates the tail area of the standardised normal curve
       from x to infinity if upperper is true or
       from minus infinity to x if upperper is .false.
    =====#

    P = 0.398942280444; Q = 0.39990348504; R = 0.398942280385;
    a1 = 5.75885480458; a2 = 2.62433121679; a3 = 5.92885724438
    b1 = -29.8213557807; b2 = 48.6959930692
    c1 = -3.8052e-8; c2 = 3.98064794e-4; c3 = -0.151679116635
    c4 = 4.8385912808;c5 = 0.742380924027; c6 = 3.99019417011
    d1 = 1.00000615302; d2 = 1.98615381364; d3 = 5.29330324926
    d4 = -15.1508972451; d5 = 30.789933034

    z > 0 && (lower = !lower)
    z = abs(z)
    if z <= 7 || !lower && z <= 18.66
        y = 0.5 * z^2
        if z > 1.28
            p = R * exp(-y) / (z + c1 + d1 / (z + c2 + d2 /
                (z + c3 + d3 / (z + c4 + d4 / (z + c5 + d5 / (z + c6))))))
        else
            p = 0.5 - z * (P - Q * y / (y + a1 + b1 / (y + a2 + b2 / (y + a3))))
        end
    else
        p = 0
    end
    !lower && (p = 1 - p)
    p
end

alnorm(1.96)         # 0.9750021048508247
alnorm(1.96, false)  # 0.024997895149175307
alnorm(-1.96)        # 0.024997895149175307
alnorm(-1.96, false) # 0.9750021048508247

R では pnorm() に相当する。

using Rmath
pnorm(1.96)          # 0.9750021048508247
pnorm(1.96, false)   # 0.024997895148220428
pnorm(-1.96)         # 0.024997895148220428
pnorm(-1.96, false)  # 0.9750021048517796

for z = -25:0.1:25
    a = alnorm(z)
    p = pnorm(z)
    if abs(a - p) > 1e-9
        println("z = $z, a = $a, p = $p, diff = $(abs(a-p))")
    end
end

#=====
z = -1.2, a = 0.11506968113439031, p = 0.11506967022170828, diff = 1.0912682035790766e-8
z = -1.1, a = 0.13566606961261096, p = 0.13566606094638264, diff = 8.666228318299218e-9
z = -1.0, a = 0.15865526063064378, p = 0.15865525393145705, diff = 6.69918673312786e-9
z = -0.9, a = 0.18406013036234564, p = 0.1840601253467595, diff = 5.015586140855177e-9
z = -0.8, a = 0.21185540219053878, p = 0.21185539858339666, diff = 3.6071421127825687e-9
z = -0.7, a = 0.2419636546893566, p = 0.24196365222307298, diff = 2.466283621771481e-9
z = -0.6, a = 0.2742531193320773, p = 0.2742531177500736, diff = 1.582003694711176e-9
z = 0.6, a = 0.7257468806679227, p = 0.7257468822499265, diff = 1.5820037502223272e-9
z = 0.7, a = 0.7580363453106433, p = 0.758036347776927, diff = 2.466283621771481e-9
z = 0.8, a = 0.7881445978094612, p = 0.7881446014166034, diff = 3.6071421405381443e-9
z = 0.9, a = 0.8159398696376543, p = 0.8159398746532405, diff = 5.015586168610753e-9
z = 1.0, a = 0.8413447393693563, p = 0.8413447460685429, diff = 6.699186649861133e-9
z = 1.1, a = 0.864333930387389, p = 0.8643339390536173, diff = 8.666228290543643e-9
z = 1.2, a = 0.8849303188656097, p = 0.8849303297782918, diff = 1.0912682091301917e-8
=====#

コメント
  • X
  • Facebookでシェアする
  • はてなブックマークに追加する
  • LINEでシェアする

PVアクセスランキング にほんブログ村

PVアクセスランキング にほんブログ村