奥村先生の,学力テストの主成分分析のバイプロット
https://www.scoopnest.com/ja/user/h_okumura/903961406004805632-
に対して,
Taylor さんから,
> すごい。この図を一目見ただけで、視覚的に(←重要)とても多くのことが分かるってのはまさに主成分分析の威力か。あえて言うなら、第1軸、第2軸の寄与率が多少気になるところ。
というコメントがあってですね。
寄与率は
> d = read.csv("atest2017.csv")[,-1]
> rownames(d) = c("北海道", "青森", "岩手", "宮城", "秋田",
+ "山形", "福島", "茨城", "栃木", "群馬",
+ "埼玉", "千葉", "東京", "神奈川", "新潟",
+ "富山", "石川", "福井", "山梨", "長野",
+ "岐阜", "静岡", "愛知", "三重", "滋賀",
+ "京都", "大阪", "兵庫", "奈良", "和歌山",
+ "鳥取", "島根", "岡山", "広島", "山口",
+ "徳島", "香川", "愛媛", "高知", "福岡",
+ "佐賀", "長崎", "熊本", "大分", "宮崎",
+ "鹿児島", "沖縄")
> a = prcomp(d) # scale=FALSE
> print(a)
Standard deviations (1, .., p=8):
[1] 4.8600239 2.4245367 1.4255179 0.9540044 0.6784466 0.6582192 0.4617722 0.3711827
Rotation (n x k) = (8 x 8):
PC1 PC2 PC3 PC4 PC5 PC6 PC7 PC8
小国A 0.2685353 0.2966870 0.3536034 -0.3922446 -0.47633410 0.5021088 -0.26976989 0.09587030
小国B 0.3559633 0.3486860 0.1517456 0.6129057 -0.36436550 -0.4430136 -0.09111218 0.12531363
小算A 0.2876291 0.5301904 -0.1242260 -0.4727719 0.47286916 -0.3866795 -0.13117396 0.08300222
小算B 0.3636727 0.3189432 -0.5000904 0.2562970 0.09810079 0.5004983 0.35105253 -0.25860909
中国A 0.3181836 -0.1678676 0.3342071 -0.2460678 -0.09212964 -0.1682090 0.80864133 0.08748155
中国B 0.3775471 -0.2166936 0.5331339 0.2060371 0.47944475 0.1294554 -0.22278065 -0.43308407
中数A 0.4343985 -0.4446556 -0.4062962 -0.2579537 -0.34817753 -0.2679320 -0.22925760 -0.36930797
中数B 0.3920535 -0.3670341 -0.1594133 0.1083912 0.21801803 0.1864553 -0.14962358 0.75480735
> x = a$sdev
> x^2/sum(x^2)
[1] 0.701197578 0.174510320 0.060326614 0.027018693 0.013664536 0.012861885 0.006330224 0.004090149
> cumsum(x^2)/sum(x^2)
[1] 0.7011976 0.8757079 0.9360345 0.9630532 0.9767177 0.9895796 0.9959099 1.0000000
ということで,第1,第2主成分の寄与率は,70.1% と 17.5% で,かなり違っているということです。
奥村先生の示したバイプロットは
> biplot(a, cex=0.6) # , pc.biplot=FALSE; default
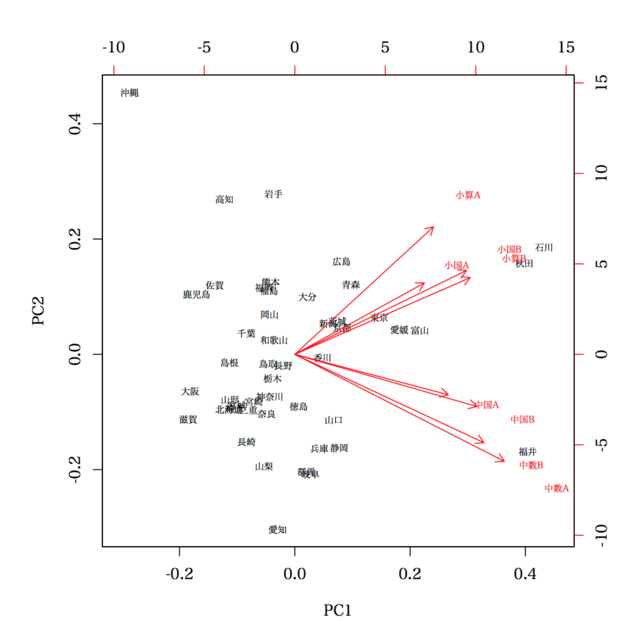
です。prcomp(d, scale=FALSE) であることに注意。また,biplot(a, cex=0.6, pc.biplot=FALSE) であることにも注意。
biplot(a2, cex=0.6, pc.biplot=TRUE) とする場合には,目盛りが変わります。
> biplot(a2, cex=0.6, pc.biplot=TRUE)
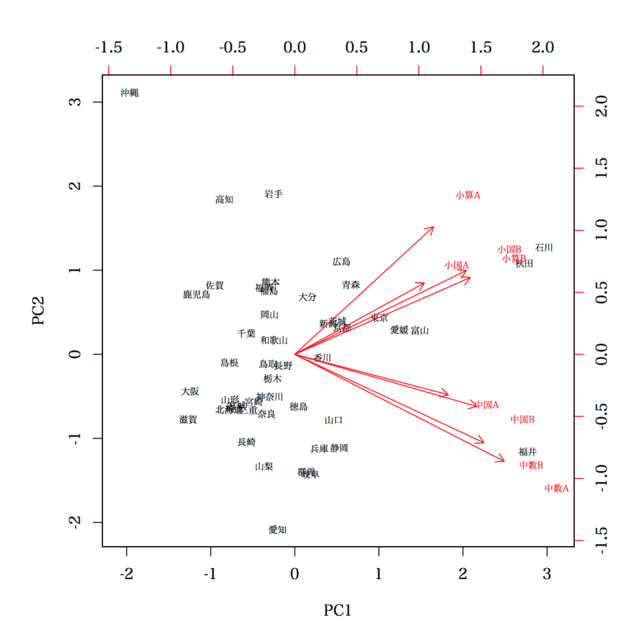
なぜ,目盛りが変わるかというと,
pc.biplot |
If true, use what Gabriel (1971) refers to as a "principal component biplot", with lambda = 1 and observations scaled up by sqrt(n) and variables scaled down by sqrt(n). Then inner products between variables approximate covariances and distances between observations approximate Mahalanobis distance.
|
ということなのではありますが,この図からそんな情報を読み取るという意気込みを持つ人はいないと思われ,むしろ,単純に図を見て,「誤った情報をくみ取る」ことがあるのではないかと危惧されます。たとえば,「福井と中数Aが近い!!」とか。
さて,もう一方で,主成分分析は,変数を正規化するかどうか(分散共分散行列からスタートするか,相関係数行列からスタートするか)というのがあり,奥村先生は前者を取ったわけですが,後者を取った場合にはどうなるか,
> b = prcomp(d, scale=TRUE)
> print(b)
Standard deviations (1, .., p=8):
[1] 2.3667078 1.1682792 0.7013992 0.4755625 0.3574532 0.3142276 0.2452455 0.1704118
Rotation (n x k) = (8 x 8):
PC1 PC2 PC3 PC4 PC5 PC6 PC7 PC8
小国A 0.3452283 0.3287580 0.45731718 -0.3634967 -0.621926560 0.06238154 -0.1916828 0.06356397
小国B 0.3643624 0.2958606 0.04867583 0.6916666 0.004563749 -0.50656879 -0.1764822 0.10562112
小算A 0.3093163 0.5172346 -0.12949306 -0.3864072 0.650100244 0.07318099 -0.1923574 0.07566833
小算B 0.3560964 0.2752739 -0.54310255 0.1375482 -0.279154784 0.33005870 0.4938781 -0.22969101
中国A 0.3772570 -0.2566438 0.34553984 -0.1992751 0.207000000 -0.33832347 0.6852228 0.07655498
中国B 0.3675927 -0.2743884 0.39488637 0.3058082 0.237866718 0.53923815 -0.1760226 -0.40223179
中数A 0.3433546 -0.4017514 -0.37533376 -0.2957626 -0.101814031 -0.39864743 -0.3525097 -0.44587388
中数B 0.3608830 -0.3981434 -0.24607800 0.0230828 -0.053227183 0.24706694 -0.1625342 0.74824164
> biplot(b, cex=0.6, pc.biplot=TRUE)
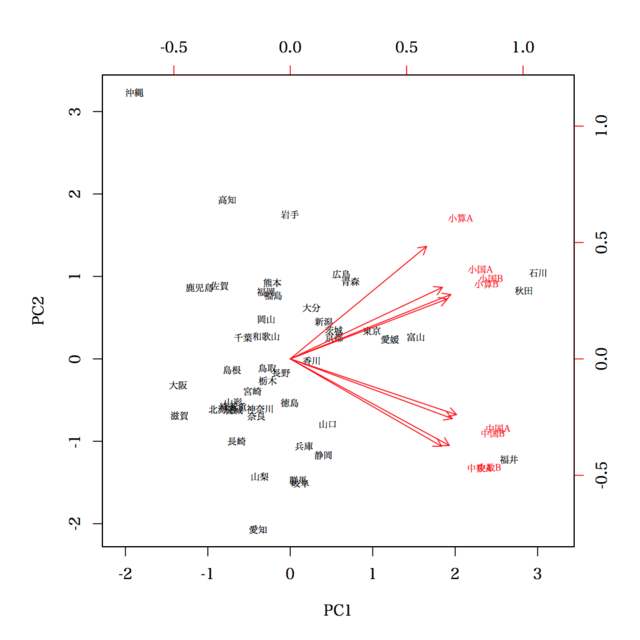
あまり変わらないと言えば変わらないが。
しかし,いずれにしても,biplot は ? biplot で見るように
There are many variations on biplots (see the references) and perhaps the most widely used one is implemented by biplot.princomp.
ということで,どのような基準(やりかた)で書かれたものかを理解していないと,誤った判断をしてしまう可能性が大である。
ということで,主成分(重み)ではなく,主成分負荷量と主成分得点を別々に描く方がよいのではないかと思う次第ではある。
http://aoki2.si.gunma-u.ac.jp/R/prcomp2.html にあるような,主成分分析の結果を表すときによく使われる(?)普通の表現で,
> prcomp2(d)
PC1 PC2 Contribution
小国A 0.817 0.384 0.815
小国B 0.862 0.346 0.863
小算A 0.732 0.604 0.901
小算B 0.843 0.322 0.814
中国A 0.893 -0.300 0.887
中国B 0.870 -0.321 0.860
中数A 0.813 -0.469 0.881
中数B 0.854 -0.465 0.946
Eigen.values 5.601 1.365
Proportion 70.016 17.061
Cumulative.prop. 70.016 87.077
> x = t(b$sdev*t(b$rotation))
> #quartz("atest2017", width=5, height=5)
> plot(x[,1], x[,2], pch=19, xlim=c(-1,1), ylim=c(-1,1), asp=1, xaxt="n", yaxt="n", xlab="", ylab="", bty="n")
> axis(1, at=-4:4*0.25, pos=0)
> axis(2, at=-4:4*0.25, pos=0)
> text(x[,1], x[,2], colnames(d), pos=c(2,4,4,1, 4,2,2,4))
> abline(h=0, v=0)
> theta = seq(0, 2*pi, length=1000)
> x = cos(theta)
> y = sin(theta)
> lines(x, y, lty=3, col="red")
これによって描かれるのは,主成分負荷量。赤の破線は主成分負荷量の二乗(寄与率)が 1 となる境界。これに近いほど,寄与率が高いということ。
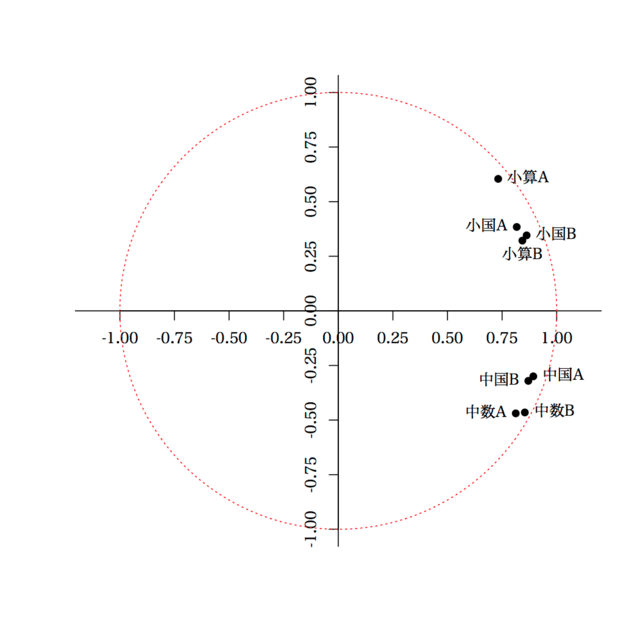
主成分得点のプロットは
> plot(b$x[,1], b$x[,2], pch=19, cex=0.6, xlab="PC1", ylab="PC2")
> text(b$x[,1], b$x[,2], rownames(d), cex=0.6, pos=4)
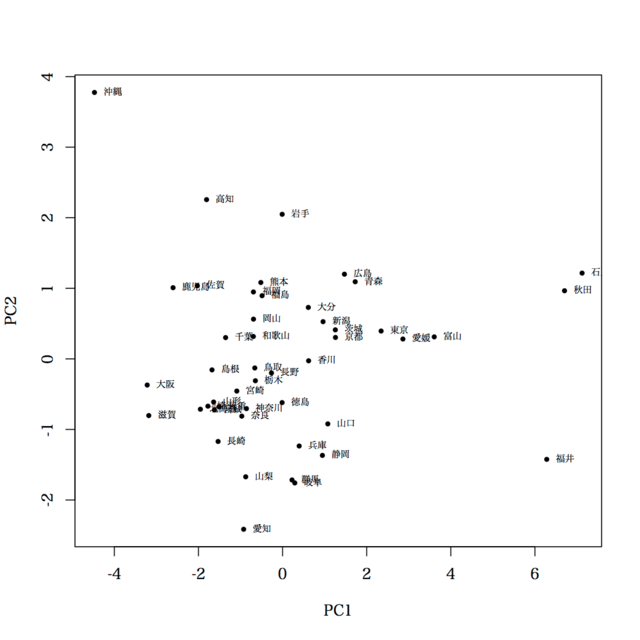
最後の 2 つを 1 枚のグラフにまとめたのが biplot の一例。
しかし,2 枚の図を別々に見れば,変な誤解は生まれようがない。
まとめ
・prcomp で scale = FALSE / TRUE いずれにするか
・biplot で pc.biplot=FALSE / TRUE いずれにするか
・biplot をやめるかどうか


