裏 RjpWiki

Julia ときどき R, Python によるコンピュータプログラム,コンピュータ・サイエンス,統計学

Julia に翻訳--214 二群の平均値の差の検定

2021年04月30日 | ブログラミング

#==========
Julia の修行をするときに,いろいろなプログラムを書き換えるのは有効な方法だ。
以下のプログラムを Julia に翻訳してみる。

二群の平均値の差の検定
http://aoki2.si.gunma-u.ac.jp/R/my-t-test.html

ファイル名: myttest.jl
関数名:   myttest(x, y; varequal = false)
         myttest(nx, mx, ux, ny, my, uy; varequal = false)

翻訳するときに書いたメモ

==========#

using Statistics, Rmath, Printf

function myttest(x, y; varequal = false)
    myttest(length(x), mean(x), var(x), length(y), mean(y), var(y); varequal)
end

function myttest(nx, mx, ux, ny, my, uy; varequal = false)
    if varequal
        df = nx + ny - 2
        v = ((nx - 1) * ux + (ny - 1) * uy) / df
        tstat = abs(mx - my) / sqrt(v * (1 / nx + 1 / ny))
    else
        tstat = abs(mx - my) / sqrt(ux / nx + uy / ny)
        df = (ux / nx + uy / ny) ^ 2 / ((ux / nx) ^ 2 / (nx - 1) + (uy / ny) ^ 2 / (ny - 1))
    end
    pvalue = 2pt(tstat, df, false)
    @printf("t = %.5f,  df = %.5f,  p value = %.5f\n", tstat, df, pvalue)
end

x = [44, 50, 52, 53, 49, 53, 47, 44, 38, 62];
y = [60, 55, 49, 58, 72, 69, 61, 63, 61, 55, 59, 63];
myttest(x, y, varequal=true) # t = 4.13039,  df = 20.00000,  p value = 0.00052
myttest(x, y)                # t = 4.10725,  df = 18.82177,  p value = 0.00061

myttest(36, 82.6, 15.3, 43, 84.5, 16.2, varequal=true) # t = 2.11652,  df = 77.00000,  p value = 0.03753
myttest(36, 82.6, 15.3, 43, 84.5, 16.2)                # t = 2.12195,  df = 75.26729,  p value = 0.03713

コメント
  • X
  • Facebookでシェアする
  • はてなブックマークに追加する
  • LINEでシェアする

Julia に翻訳--213 母平均の検定と推定

2021年04月30日 | ブログラミング

#==========
Julia の修行をするときに,いろいろなプログラムを書き換えるのは有効な方法だ。
以下のプログラムを Julia に翻訳してみる。

母平均の検定と推定
http://aoki2.si.gunma-u.ac.jp/lecture/Average/Mean1-r.html

ファイル名: onesamplettest.jl
関数名:   onesamplettest(x, mu0; conflevel=0.95)
         onesamplettest(n, xbar, u, mu0; conflevel=0.95)

翻訳するときに書いたメモ

==========#

using Statistics, StatsBase, Rmath, Printf

function onesamplettest(x, mu0; conflevel=0.95)
    n = length(x)
    xbar = mean(x)
    u = var(x)
    se = sqrt(u/n)
    t0 = abs(xbar - mu0) / se
    df = n - 1
    pvalue = 2pt(t0, df, false)
    @printf("t = %.5f,  df = %d,  p value = %.5f\n", t0, df, pvalue)
    t1 = qt((1 + conflevel)/2, df)
    lcl, ucl = xbar .+ [-1, 1]t1 .* se
    @printf("%s%% confidence interval = [%.5f, %.5f]\n", 100conflevel, lcl, ucl)
end

function onesamplettest(n, xbar, u, mu0; conflevel=0.95)
    x = randn(n);
    x = (x .- mean(x)) ./ std(x) .* sqrt(u) .+ xbar;
    onesamplettest(x, mu0; conflevel)
end

onesamplettest(31, 157.8, 24.6, 156.2)
# t = 1.79611,  df = 30,  p value = 0.08255
# 95.0% confidence interval = [155.98072, 159.61928]

x = [9.7, 10.3, 9.6, 7.7, 10.2, 10.6, 10.4, 11.4, 7.8, 8.6];
onesamplettest(x, 10.0)
# t = 0.95248,  df = 9,  p value = 0.36573
# 95.0% confidence interval = [8.75125, 10.50875]

onesamplettest(length(x), mean(x), var(x), 10)
# t = 0.95248,  df = 9,  p value = 0.36573
# 95.0% confidence interval = [8.75125, 10.50875]

コメント
  • X
  • Facebookでシェアする
  • はてなブックマークに追加する
  • LINEでシェアする

Julia に翻訳--212 二群の比率の差の検定

2021年04月30日 | ブログラミング

#==========
Julia の修行をするときに,いろいろなプログラムを書き換えるのは有効な方法だ。
以下のプログラムを Julia に翻訳してみる。

二群の比率の差の検定
http://aoki2.si.gunma-u.ac.jp/lecture/Hiritu/diff-p-test-r.html

ファイル名: proptest.jl
関数名:    proptest(x::Vector{Int64}, n::Vector{Int64}; correction=true)
          proptest(x::Array{Int64,2}; correction=true)

翻訳するときに書いたメモ

K 群の比率の差の検定は,2xK 分割表での独立性の検定と同じである。ということで,chisqtest2 関数を下請けにしている。
下のプログラムは,2群の比率の差の検定だけでなく,K群の比率の差の検定にも対応している。

==========#

using Rmath, Printf

function proptest(x::Vector{Int64}, n::Vector{Int64}; correction=true)
    chisqtest2(hcat(x, n .- x); correction)
end

function proptest(x::Array{Int64,2}; correction=true)
    chisqtest2(x; correction)
end

function chisqtest2(x; correction=true)
    n, m = size(x)
    rowsum = sum(x, dims=2)
    colsum = sum(x, dims=1)
    expectation =  (rowsum * colsum) ./ sum(x)
    if sum(expectation .< 1) >= 1 ||sum(expectation .< 5) >= 0.2n*m
        println("Warning message: Chi-squared approximation may be incorrect")
    end
    difference = abs.(x - expectation)
    yates = 0
    correction && n == 2 && m == 2 && (yates = min(0.5, minimum(difference)))
    chisq = sum(((difference .- yates) .^ 2) ./ expectation)
    df =(n - 1) * (m - 1)
    pvalue = pchisq(chisq, df, false)
    @printf("chisq = %.5f,  df = %d,  p value = %.5f", chisq, df, pvalue)
end

smokers  = [83, 90, 129, 70]
patients = [86, 93, 136, 82];
proptest(smokers, patients) # chisq = 12.60041,  df = 3,  p value = 0.00559

data = [83 90 129 70
         3  3   7 12];
proptest(data)              # chisq = 12.60041,  df = 3,  p value = 0.00559

proptest([145, 157], [300, 250], correction=false) # chisq = 11.52663,  df = 1,  p value = 0.00069
proptest([145, 157], [300, 250])                   # chisq = 10.94973,  df = 1,  p value = 0.00094

コメント
  • X
  • Facebookでシェアする
  • はてなブックマークに追加する
  • LINEでシェアする

Julia に翻訳--211 分布の差の検定,独立性の検定,K×M 分割表,2×2 分割表

2021年04月30日 | ブログラミング

#==========
Julia の修行をするときに,いろいろなプログラムを書き換えるのは有効な方法だ。
以下のプログラムを Julia に翻訳してみる。

分布の差の検定(独立性の検定)
http://aoki2.si.gunma-u.ac.jp/lecture/Cross/differenceofdist-r.html

独立性の検定(K×M 分割表)
http://aoki2.si.gunma-u.ac.jp/lecture/Cross/cross-r.html

独立性の検定(2×2 分割表)
http://aoki2.si.gunma-u.ac.jp/lecture/Cross/cross-r2.html

ファイル名: chisqtest2.jl  関数名: chisqtest2

翻訳するときに書いたメモ

==========#

using Rmath, Printf

function chisqtest2(x; correction=true)
    n, m = size(x)
    rowsum = sum(x, dims=2)
    colsum = sum(x, dims=1)
    expectation =  (rowsum * colsum) ./ sum(x)
    if sum(expectation .< 1) >= 1 ||sum(expectation .< 5) >= 0.2n*m
        println("Warning message: Chi-squared approximation may be incorrect")
    end
    difference = abs.(x - expectation)
    yates = 0
    correction && n == 2 && m == 2 && (yates = min(0.5, minimum(difference)))
    chisq = sum(((difference .- yates) .^ 2) ./ expectation)
    df =(n - 1) * (m - 1)
    pvalue = pchisq(chisq, df, false)
    @printf("chisq = %.5f,  df = %d,  p value = %.5f", chisq, df, pvalue)
end

x = [20 15 16 4
     15  7  9 4];

chisqtest2(x)
# Warning message: Chi-squared approximation may be incorrect
# chisq = 1.19810,  df = 3,  p value = 0.75346

x = [4 2
     1 6];

chisqtest2(x, correction=false)
# Warning message: Chi-squared approximation may be incorrect
# chisq = 3.74524,  df = 1,  p value = 0.05296

chisqtest2(x)
# Warning message: Chi-squared approximation may be incorrect
# chisq = 1.85908,  df = 1,  p value = 0.17273

コメント
  • X
  • Facebookでシェアする
  • はてなブックマークに追加する
  • LINEでシェアする

Julia に翻訳--210 適合度の検定,名義尺度の場合,χ2 分布による検定,一様性の検定,理論比が与えられる場合

2021年04月30日 | ブログラミング

#==========
Julia の修行をするときに,いろいろなプログラムを書き換えるのは有効な方法だ。
以下のプログラムを Julia に翻訳してみる。

適合度の検定--名義尺度の場合;χ2 分布による検定;一様性の検定
http://aoki2.si.gunma-u.ac.jp/lecture/GoodnessOfFitness/nominalscale-r.html

適合度の検定--名義尺度の場合;χ2 分布による検定;理論比が与えられる場合
http://aoki2.si.gunma-u.ac.jp/lecture/GoodnessOfFitness/nominalscale-r2.html

ファイル名: chisqtest.jl  関数名: chisqtest

翻訳するときに書いたメモ

==========#

using Rmath, Printf

function chisqtest(x; p = fill(1 / length(x), length(x)))
    1 - sum(p) > eps() && error("sum(p) isn't equal to 1")
    expectation =  sum(x) .* p
    chisq = sum(((x .- expectation) .^ 2) ./ expectation)
    df = length(x) - 1
    pvalue = pchisq(chisq, df, false)
    @printf("chisq = %.5f,  df = %d,  p value = %.5f", chisq, df, pvalue)
end

x = [10, 12, 9, 4, 13, 8]
chisqtest(x)                         # chisq = 5.50000,  df = 5,  p value = 0.35795
chisqtest(x, p = fill(1/6, 6))       # chisq = 5.50000,  df = 5,  p value = 0.35795

y = [29, 12, 8, 2]

chisqtest(y, p = repeat([0.25], 4))  # chisq = 31.58824,  df = 3,  p value = 0.00000
chisqtest(y, p = [9, 3, 3, 1] ./ 16) # chisq = 1.32244,  df = 3,  p value = 0.72381

コメント
  • X
  • Facebookでシェアする
  • はてなブックマークに追加する
  • LINEでシェアする

Julia に翻訳--209 一般化固有値問題

2021年04月29日 | ブログラミング

#==========
Julia の修行をするときに,いろいろなプログラムを書き換えるのは有効な方法だ。
以下のプログラムを Julia に翻訳してみる。

一般化固有値問題
http://aoki2.si.gunma-u.ac.jp/R/geneig.html

ファイル名: geneig.jl  関数名: geneig

翻訳するときに書いたメモ

普通の固有値・固有ベクトルを求める関数と同じ名前 eigen で用意されていた。

==========#

using LinearAlgebra, NamedArrays

function geneig(a, b)
  if size(a, 1) == 1
    return a / b, 1
  else
    values, v = eigen(b, sortby=x -> -x)
    g = Diagonal(1 ./ sqrt.(values))
    values, vectors = eigen(g * transpose(v) * a * v * g, sortby=x -> -x)
    vectors = v * g * vectors
  end
  values, vectors
end

A = [ 1   1    0.5
      1   1    0.25
      0.5 0.25 2];
B = [2 2 2
     2 5 5
     2 5 11];
values, vectors = geneig(A, B);
println("\neigenvalues\n", NamedArray(reshape(values, 1, :)))
#=====
eigenvalues
1×3 Named Matrix{Float64}
A ╲ B │           1            2            3
──────┼──────────────────────────────────────
1     │    0.610644     0.315047  -0.00902431
=====#

println("\neigenvectors\n", NamedArray(vectors))
#=====

eigenvectors
3×3 Named Matrix{Float64}
A ╲ B │         1          2          3
──────┼────────────────────────────────
1     │ -0.526391  -0.514599  -0.539846
2     │  -0.28178    0.40262   0.508427
3     │  0.247944    -0.3184  0.0617449
=====#

values2, vectors2 = eigen(A, B, sortby=x-> -x)
println("\neigenvalues\n", NamedArray(reshape(values, 1, :)))
#=====

eigenvalues
1×3 Named Matrix{Float64}
A ╲ B │           1            2            3
──────┼──────────────────────────────────────
1     │    0.610644     0.315047  -0.00902431
=====#

println("\neigenvectors\n", NamedArray(vectors))
#=====

eigenvectors
3×3 Named Matrix{Float64}
A ╲ B │         1          2          3
──────┼────────────────────────────────
1     │ -0.526391  -0.514599  -0.539846
2     │  -0.28178    0.40262   0.508427
3     │  0.247944    -0.3184  0.0617449
=====#

コメント
  • X
  • Facebookでシェアする
  • はてなブックマークに追加する
  • LINEでシェアする

Julia に翻訳--208 素数判定,素因子分解,約数

2021年04月29日 | ブログラミング

#==========
Julia の修行をするときに,いろいろなプログラムを書き換えるのは有効な方法だ。
以下のプログラムを Julia に翻訳してみる。

素数判定,素因子分解,約数
http://aoki2.si.gunma-u.ac.jp/R/divisor.html

ファイル名: primes.jl
既存の関数名: factor, prodfactors, primes, nextprime, prevprime,
            isprime, ismersenneprime。gcd

翻訳するときに書いたメモ

==========#


using Primes

# 素因数分解の表示法 1
factor(100) # 2^2 * 5^2

# 素因数分解の表示法 2
using DataStructures
factor(DataStructures.SortedDict, 100) # SortedDict(Dict(2 =>2, 5 => 2))

# 素因数分解の結果の表示法 3
factor(Vector, 100) # [2, 2, 5, 5]

# 素因数だけの表示
factor(Set, 100) # [5, 2]

# 素因数分解から元の数を計算
Base.prod([2^2, 5^2]) # 100
prodfactors([2^2, 5^2]) # 100

# 指定範囲中の素数
primes(2, 20) # [2, 3, 5, 7, 11, 13, 17, 19]
primes(5) # [2, 3, 5]

# 次の素数
nextprime(1000) # 1009
nextprime(10000000000) # 10000000019
factor(10000000019) # 10000000019

gcd(nextprime(10000000000), 2) # 1

factor(nextprime(10000000000)-1) # 2 * 131 * 521 * 73259

# 最大公約数
gcd(nextprime(10000000000)-1, 73259) # 73259

# 前の素数
nextprime(10000000000) # 10000000019
prevprime(10000000018) # 9999999967
nextprime(9999999968)  # 10000000019

# n 番目の素数
[prime(i) for i = 1:10] # [2, 3, 5, 7, 11, 13, 17, 19, 23, 29]

# 素数判定
isprime(5)           # true
isprime(10000000019) # true
isprime(10000000018) # fase

# メルセンス素数
ismersenneprime(2^11 - 1) # false
isprime(2^11 - 1)         # false
factor(2^11 - 1)          # 23 * 89
2^11 - 1 # 2047
23 * 89  # 2047
ismersenneprime(2^13 - 1) # true
2^13 - 1                  # 8191
factor(2^13 - 1)          # 8191

# 素数マスク
mask = primesmask(20) # [0,1,1,0,1,0,1,0,0,0,1,0,1,0,0,0,1,0,1,0]
(1:20)[mask] # [2, 3, 5, 7, 11, 13, 17, 19]
(1:20)[Vector{Bool}([0,1,1,0,1,0,1,0,0,0,1,0,1,0,0,0,1,0,1,0])] # [2, 3, 5, 7, 11, 13, 17, 19]

コメント
  • X
  • Facebookでシェアする
  • はてなブックマークに追加する
  • LINEでシェアする

Julia に翻訳--207 フィボナッチ数

2021年04月29日 | ブログラミング

#==========
Julia の修行をするときに,いろいろなプログラムを書き換えるのは有効な方法だ。
以下のプログラムを Julia に翻訳してみる。

n 番目のフィボナッチ数を求める
http://aoki2.si.gunma-u.ac.jp/R/longFibonacci.html
http://aoki2.si.gunma-u.ac.jp/R/Fibonacci.html

ファイル名: fibonacci.jl  関数名: fibonacci(n::Int), fibonacci(n::BigInt)

翻訳するときに書いたメモ

==========#

fibonacci(n::Int) = (((1+sqrt(BigInt(5)))/2)^n - ((1-sqrt(BigInt(5)))/2)^n) / sqrt(BigInt(5))

function fibonacci(n::BigInt)

    n < 3 && return 1
    a::BigInt = b::BigInt = 1
    for i = 3:n
        a, b = b, a + b
    end
    b
end

       fibonacci(358) 2.938259894663965643334199512556443301668334686724228058421789119362146592794727e+74
   fibonacci(big(358)) 293825989466396564333419951255644330166833468672422805842178911936214659279
fibonacci(BigInt(358)) 293825989466396564333419951255644330166833468672422805842178911936214659279

fibonacci(big(12345)) 4008056950 で始まり 5899927970 で終わる,2580 桁の数

Python では

import gmpy
gmpy.fib(12345)

コメント
  • X
  • Facebookでシェアする
  • はてなブックマークに追加する
  • LINEでシェアする

Julia に翻訳--206 数量化 IV 類

2021年04月29日 | ブログラミング

#==========
Julia の修行をするときに,いろいろなプログラムを書き換えるのは有効な方法だ。
以下のプログラムを Julia に翻訳してみる。

数量化 IV 類
http://aoki2.si.gunma-u.ac.jp/R/qt4.html

ファイル名: qt4.jl  関数名: qt4, printqt4, plotqt4

翻訳するときに書いたメモ

==========#

using LinearAlgebra, NamedArrays, Plots

function qt4(s; name=[])
    n, n2 = size(s)
    n != n2 && error("s must be a square matrix. $nx$n2")
    length(name) == 0 && (name = ["Obj-$i" for i = 1:n])
    h = s + transpose(s)
    [h[i, i] = 0 for i = 1:n]
    rowsum = -sum(h, dims=2)
    [h[i, i] = rowsum[i] for i = 1:n]
    values, vectors = eigen(h, sortby=x-> -x)
    ax = sum(values .> 1e-5)
    values = values[1:ax]
    vectors = vectors[:, 1:ax]
    axisname = ["Axis-$i" for i = 1:ax]
    Dict(:ax => ax, :n => n, :values => values, :vectors => vectors,
         :axisname => axisname, :name => name)
end

function printqt4(obj)
    axisname = obj[:axisname]
    val = obj[:values]
    val2 = val ./ sum(val)
    println("\n", NamedArray(hcat(val, val2, cumsum(val2))', (["Eigenvalue", "Contribution", "Cum. cont."], axisname)))
    println("\nvector\n", NamedArray(obj[:vectors], (obj[:name], axisname)))
end

function plotqt4(obj)
    obj[:ax] >= 2 || error("解が一次元なので,二次元配置図は描けません。")
    xy = obj[:vectors][:, 1:2]
    label = ["  $s" for s in obj[:name]]
    pyplot()
    plt = scatter(xy[:, 1], xy[:, 2], grid=false,
                  tick_direction=:out, color=:black,
                  xlabel="Axis-1", ylabel="Axis-2", label="")
    annotate!.(xy[:, 1], xy[:, 2], text.(label, 8, :left))
    display(plt)
end

s = [
      0 -3 -5 -1
     -1  0 -2 -3
     -2 -3  0 -2
     -3 -4 -1  0
    ];

obj = qt4(s)
printqt4(obj)
#=====

3×3 Named Adjoint{Float64, Matrix{Float64}}
       A ╲ B │   Axis-1    Axis-2    Axis-3
─────────────┼─────────────────────────────
Eigenvalue   │  23.1496   21.1747   15.6757
Contribution │ 0.385827  0.352912  0.261261
Cum. cont.   │ 0.385827  0.738739       1.0

vector
4×3 Named Matrix{Float64}
A ╲ B │    Axis-1     Axis-2     Axis-3
──────┼────────────────────────────────
Obj-1 │  0.385193   0.622995  -0.462064
Obj-2 │  0.601466  -0.529103   0.329072
Obj-3 │   -0.5328  -0.451618  -0.512021
Obj-4 │  -0.45386   0.357727   0.645014
=====#

plotqt4(obj); savefig("fig1.png")

コメント
  • X
  • Facebookでシェアする
  • はてなブックマークに追加する
  • LINEでシェアする

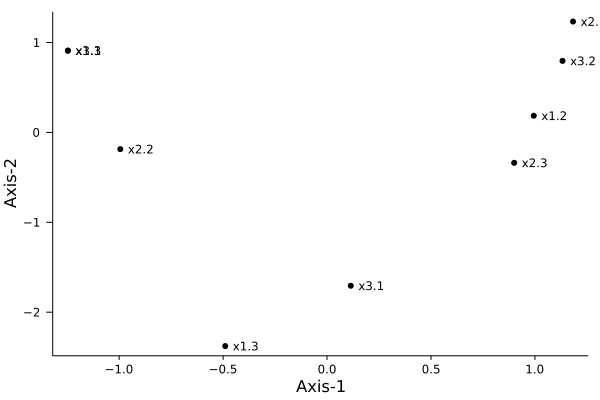
Julia に翻訳--205 量化 III 類

2021年04月29日 | ブログラミング

#==========
Julia の修行をするときに,いろいろなプログラムを書き換えるのは有効な方法だ。
以下のプログラムを Julia に翻訳してみる。

数量化 III 類
http://aoki2.si.gunma-u.ac.jp/R/qt3.html

ファイル名: qt3.jl  関数名: qt3, printqt3, plotqt3

翻訳するときに書いたメモ

==========#

using Rmath, LinearAlgebra, NamedArrays, Plots

function qt3(dat; vname=[], cname=[])
    nc, item = size(dat)
    if any(dat .>= 3)
        length(vname) > 0 || (vname = ["x$i" for i = 1:item])
        cat = vec(maximum(dat, dims=1))
        nobe = sum(cat)
        dat2 = zeros(Int, nc, nobe)
        for i = 1:nc
            x0 = []
            for j = 1:item
                zeros0 = zeros(cat[j])
                zeros0[dat[i, j]] = 1
                append!(x0, zeros0)
            end
            dat2[i, :] = x0
        end
        if length(cname) == 0
            cname = []
            for i = 1:item
                append!(cname, ["$(vname[i]).$j" for j = 1:cat[i]])
            end
        end
    else
        length(cname) > 0 || (cname = ["Cat-$i" for i = 1:item])
        dat2 = dat
    end
    nobe = size(dat2, 2)
    ncc = sum(dat2, dims=2)
    ni = vec(sum(dat2, dims=1))
    any(ncc .== 0) && error("反応が0のケースがあります")
    any(ni  .== 0) && error("反応が0のカテゴリーがあります")
    fnorm = sum(ni)
    x = zeros(nobe, nobe)
    for i = 1:nc
        x += (dat2[i, :] * dat2[i, :]') / ncc[i]
    end
    values, vectors = eigen(x ./ sqrt.(ni * ni'), sortby=x-> -x)
    ne = sum(values .> 1e-5)
    axisname = ["Axis-$i" for i = 1:ne-1]
    values = values[2:ne]
    vectors = vectors .* sqrt.(fnorm ./ ni)
    corr = sqrt.(values)
    catscore = vectors[:, 2:ne]
    smpscore = dat2 * catscore ./ (ncc * sqrt.(values)')
    Dict(:nc => nc, :Eigenvalue => values, :Correlationcoefficient => corr,
         :Categoryscore => catscore, :Samplescore => smpscore,
         :vname => vname, :cname => cname, :axisname => axisname)
end

function printqt3(obj)
    axisname = obj[:axisname]
    println("\n", NamedArray(hcat(obj[:Eigenvalue], obj[:Correlationcoefficient])',
        (["Eigenvalue", "Correlation coefficient"], axisname)))
    println("\nCatrgory score\n", NamedArray(obj[:Categoryscore], (obj[:cname], axisname)))
    println("\nSample score\n", NamedArray(obj[:Samplescore],
        (1:obj[:nc], axisname)))
end

function plotqt3(obj; axis1 = 1, axis2 = 2, xlabel = "", ylabel = "",
                 which = "categoryscore", annotate = true) # or "samplescore"
    length(obj[:Eigenvalue]) == 1 && error("解が一次元なので,二次元表示はできません。")
    if which == "categoryscore"
        dat = obj[:Categoryscore]
        label = obj[:cname]
    else
        dat = obj[:Samplescore]
        label = 1:obj[:nc]
    end
    label = ["  $l" for l in label]
    axisname = obj[:axisname]
    xlabel == "" && (xlabel = axisname[axis1])
    ylabel == "" && (ylabel = axisname[axis2])
    x = dat[:, axis1]
    y = dat[:, axis2]
    plt = scatter(x, y, grid=false, tick_direction = :out,
                  color = :black, xlabel = xlabel, ylabel = ylabel, label = "")
    annotate == true && annotate!.(x, y, text.(label, 8, :left))
    display(plt)
end

dat = [
    1 2 3
    3 2 1
    2 3 1
    1 2 3
    2 1 2
    2 3 2
]
obj = qt3(dat)

printqt3(obj)
#=====

2×4 Named Adjoint{Float64, Matrix{Float64}}
                  A ╲ B │   Axis-1    Axis-2    Axis-3    Axis-4
────────────────────────┼───────────────────────────────────────
Eigenvalue              │ 0.932531  0.598608  0.361922  0.106938
Correlation coefficient │ 0.965677  0.773698    0.6016  0.327013

Catrgory score
9×4 Named Matrix{Float64}
A ╲ B │    Axis-1     Axis-2     Axis-3     Axis-4
──────┼───────────────────────────────────────────
x1.1  │  -1.24668   0.909671   0.370592   -0.22888
x1.2  │  0.994342   0.185732   0.338808  -0.384332
x1.3  │ -0.489673   -2.37654   -1.75761    1.61076
x2.1  │    1.1832    1.23348   -2.56331   -1.94775
x2.2  │ -0.994342  -0.185732  -0.338808   0.384332
x2.3  │  0.899914  -0.338144    1.78987   0.397375
x3.1  │  0.114108   -1.70558   0.188063   -1.47834
x3.2  │   1.13257   0.795906  -0.558655    1.70722
x3.3  │  -1.24668   0.909671   0.370592   -0.22888

Sample score
6×4 Named Matrix{Float64}
A ╲ B │     Axis-1      Axis-2      Axis-3      Axis-4
──────┼───────────────────────────────────────────────
1     │   -1.20389    0.703811    0.222948  -0.0748468
2     │  -0.472866    -1.83872    -1.05738    0.526739
3     │   0.693249    -0.80048     1.28365    -1.49361
4     │   -1.20389    0.703811    0.222948  -0.0748468
5     │    1.14259    0.954344    -1.54209    -0.63694
6     │     1.0448    0.277237    0.869913      1.7535
=====#

catdat = [
       1       0       0       0       1       0       0       0       1
       0       0       1       0       1       0       1       0       0
       0       1       0       0       0       1       1       0       0
       1       0       0       0       1       0       0       0       1
       0       1       0       1       0       0       0       1       0
       0       1       0       0       0       1       0       1       0 ];

obj2 = qt3(catdat)
printqt3(obj2)
#=====

2×4 Named Adjoint{Float64, Matrix{Float64}}
                  A ╲ B │   Axis-1    Axis-2    Axis-3    Axis-4
────────────────────────┼───────────────────────────────────────
Eigenvalue              │ 0.932531  0.598608  0.361922  0.106938
Correlation coefficient │ 0.965677  0.773698    0.6016  0.327013

Catrgory score
9×4 Named Matrix{Float64}
A ╲ B │    Axis-1     Axis-2     Axis-3     Axis-4
──────┼───────────────────────────────────────────
Cat-1 │  -1.24668   0.909671   0.370592   -0.22888
Cat-2 │  0.994342   0.185732   0.338808  -0.384332
Cat-3 │ -0.489673   -2.37654   -1.75761    1.61076
Cat-4 │    1.1832    1.23348   -2.56331   -1.94775
Cat-5 │ -0.994342  -0.185732  -0.338808   0.384332
Cat-6 │  0.899914  -0.338144    1.78987   0.397375
Cat-7 │  0.114108   -1.70558   0.188063   -1.47834
Cat-8 │   1.13257   0.795906  -0.558655    1.70722
Cat-9 │  -1.24668   0.909671   0.370592   -0.22888

Sample score
6×4 Named Matrix{Float64}
A ╲ B │     Axis-1      Axis-2      Axis-3      Axis-4
──────┼───────────────────────────────────────────────
1     │   -1.20389    0.703811    0.222948  -0.0748468
2     │  -0.472866    -1.83872    -1.05738    0.526739
3     │   0.693249    -0.80048     1.28365    -1.49361
4     │   -1.20389    0.703811    0.222948  -0.0748468
5     │    1.14259    0.954344    -1.54209    -0.63694
6     │     1.0448    0.277237    0.869913      1.7535
=====#

plotqt3(obj); savefig("fig1.png")


plotqt3(obj, which="samplescore"); savefig("fig2.png")

コメント
  • X
  • Facebookでシェアする
  • はてなブックマークに追加する
  • LINEでシェアする

Julia に翻訳--204 数量化 II 類

2021年04月29日 | ブログラミング
#==========
Julia の修行をするときに,いろいろなプログラムを書き換えるのは有効な方法だ。
以下のプログラムを Julia に翻訳してみる。

数量化 II 類
http://aoki2.si.gunma-u.ac.jp/R/qt2.html

ファイル名: qt2.jl  関数名: qt2, printqt2, plotqt2

翻訳するときに書いたメモ

カテゴリーデータのまま入力できるようにしようかとも思ったが,止めた。

==========#

using StatsBase, LinearAlgebra, Rmath, NamedArrays, Plots, StatsPlots

function qt2(dat, group; vname=[], cname=[], gname=[])
    na = NamedArray
    function geneig(a, b)
        if size(a, 1) == 1
            return a / b, 1
        else
            values, vectors = eigen(b, sortby=x-> -x)
            g = Diagonal(1 ./ sqrt.(values))
            v = vectors
            values, vectors = eigen(g * v' * a * v * g, sortby=x-> -x)
            vectors = v * g * vectors
            return values, vectors
        end
    end

    nc, item = size(dat)
    index, n = table(group)
    ng = length(n)
    dat = hcat(dat, group)
    cat = vec(maximum(dat, dims=1))
    length(vname) > 0 || (vname = ["x$i" for i = 1:item])
    length(gname) > 0 || (gname = ["g$i" for i = 1:ng])
    if length(cname) == 0
        cname = []
        for i = 1:item
            append!(cname, ["$(vname[i]).$j" for j = 1:cat[i]])
        end
    end
    junjo = vcat(0, cumsum(cat)[1:end-1])
    nobe2 = sum(cat)
    nobe = nobe2 - ng
    dat2 = zeros(Int, nc, nobe2)
    for i = 1:nc
        x0 = []
        for j = 1:item + 1
            zeros0 = zeros(cat[j])
            zeros0[dat[i, j]] = 1
            append!(x0, zeros0)
        end
        dat2[i, :] = x0
    end
    a2 = zeros(Int, nobe2, nobe2, nc)
    for j = 1:nc
        a2[:, :, j] = dat2[j, :] .* dat2[j, :]'
    end
    x = sum(a2, dims=3)
    pcros = x[1:nobe, 1:nobe]
    gcros = x[(nobe + 1):nobe2, 1:nobe]
    w = (n * n') ./ nc
    [w[i, i] = 0 for i = 1:ng]
    grgr = Diagonal(n .- n .^ 2 / nc) - w
    w = diag(pcros)
    grpat = gcros - (n .* w') / nc
    pat = pcros - (w .* w') / nc
    select = (junjo .+ 1)[1:item]
    suf = trues(nobe)
    suf[select] .= false
    pat = pat[suf, suf]
    grpat = grpat[2:end, suf]
    r = grgr[2:end, 2:end]
    ndim = ng - 1
    axisname = ["Axis-$i" for i = 1:ndim]
    m = size(pat, 2)
    c = grpat * (pat \ grpat')
    values, vectors = geneig(c, r)
    w = sqrt.(values)' .\ (pat \ grpat' * vectors)
    a = zeros(nobe, ndim)
    ie = 0
    for j in 1:item
        is = ie + 1
        ie = is + cat[j] - 2
        offset = junjo[j] + 2
        a[offset:(offset + ie - is), :] = w[is:ie, :]
    end
    w = diag(pcros) .* a
    for j in 1:item
        is = junjo[j] + 1
        ie = is + cat[j] - 1
        s = sum(w[is:ie, :], dims=1) / nc
        a[is:ie, :] = a[is:ie, :] .- s
    end
    a = sqrt.(diag(a' * pcros * a) ./ nc)' .\ a
    samplescore = dat2[:, 1:nobe] * a
    centroid = n .* vcat(0, vectors)
    centroid = vcat(0, vectors) .- sum(centroid, dims=1) / nc
    centroid = sqrt.(vec(sum(centroid .^ 2 .* n, dims=1)) ./ nc ./ values)' .\ centroid
    item1 = item + 1
    partialcorr = zeros(item, ndim)
    for l = 1:ndim
        pat = zeros(item1, item1)
        pat[1, 1] = sum(n .* centroid[:, l] .^ 2)
        temp = sum(a[:, l] .* transpose(gcros .* centroid[:, l]), dims=2)
        is = junjo[1:end-1]
        ie = junjo[1:end-1] + cat[1:end-1]
        pat[1, 2:(item + 1)] = [sum(temp[is[k]+1:ie[k]]) for k = 1:length(is)]
        temp = (a[:, l] * a[:, l]') .* pcros
        for i = 1:item
            is = junjo[i] + 1
            ie = is + cat[i] - 1
            for j = 1:i
                pat[j + 1, i + 1] = sum(temp[is:ie, (junjo[j] + 1):(junjo[j] + cat[j])])
            end
        end
        d = diag(pat)
        pat = pat ./ sqrt.(d * d')
        pat = pat + transpose(pat)
        [pat[i, i] = 1 for i = 1:item1]
        pat = inv(pat)
        partialcorr[:, l] = -pat[2:item1, 1] ./ sqrt.(pat[1, 1] * diag(pat)[2:item1])
    end
    Dict(:nc => nc, :ndim => ndim, :group => group, :ng => ng, :categoryscore => a,
         :partialcorr => partialcorr, :centroid => centroid, :eta => values,
         :samplescore => samplescore, :vname => vname, :gname => gname,
         :cname => cname, :axisname => axisname)
end

function table(x) # indices が少ないとき
    indices = sort(unique(x))
    counts = zeros(Int, length(indices))
    for i in indexin(x, indices)
        counts[i] += 1
    end
    return indices, counts
end

function table(x, y) # 二次元
    indicesx = sort(unique(x))
    indicesy = sort(unique(y))
    counts = zeros(Int, length(indicesx), length(indicesy))
    for (i, j) in zip(indexin(x, indicesx), indexin(y, indicesy))
        counts[i, j] += 1
    end
    return indicesx, indicesy, counts
end

function printqt2(obj)
    axisname = obj[:axisname]
    println("\ncategory score\n", NamedArray(obj[:categoryscore], (obj[:cname], axisname)))
    println("\npartial correlation coefficient\n", NamedArray(obj[:partialcorr], (obj[:vname], axisname)))
    println("\nsample score\n", NamedArray(obj[:samplescore], (1:obj[:nc], axisname)))
    println("\ncentroids\n", NamedArray(obj[:centroid], (obj[:gname], axisname)))
    println("\neta\n", NamedArray(reshape(obj[:eta], 1, :), (["eta"], axisname)))
end

function plotqt2(obj; i = 1, j = 2, color=:blue, nclass = 20, which = "boxplot") # or "barplot" or "categoryscore"
    pyplot()
    if which == "categoryscore"
        categoryscore = obj[:categoryscore][end:-1:1, i]
        cname = [" $s " for s in obj[:cname][end:-1:1]]
        align = [c > 0 ? :right : :left for c in categoryscore]
        plt = bar(categoryscore, orientation=:h, grid=false,
                  yshowaxis=false, yticks=false,
                  xlabel=which, label="")
        annotate!.(0, 1:length(cname), text.(cname, align, 8))
        vline!([0], color=:black, label="")
    else
        group = obj[:group]
        if obj[:ndim] > 1
            xlabel, ylabel = obj[:axisname][[i, j]]
            grouplevels = obj[:gname]
            samplescore = obj[:samplescore]
            plt = scatter(samplescore[:, i], samplescore[:, j], grid=false,
                          tick_direction = :out, xlabel = xlabel,
                          ylabel = ylabel, color = color, markerstrokecolor=color,
                          label="")
        else
            if which == "boxplot"
                plt = boxplot(obj[:gname], obj[:samplescore][:, 1], grid=false,
                              tick_direction = :out, xlabel = "group",
                              ylabel = "sample score", label="")
            elseif which == "barplot"
                samplescore = obj[:samplescore][:, 1];
                minx, maxx = extrema(samplescore)
                w = (maxx - minx) / (nclass - 1)
                samplescore2 = floor.(Int, (samplescore .- minx) ./ w)
                index1, index2, res = table(samplescore2, group)
                plt = groupedbar(res, xlabel = "sample score", label="")
            end
        end
    end
    display(plt)
end

dat = [
    3  2
    3  1
    3  2
    2  1
    2  1
    3  1
    2  1
    1  2]

group = [1, 2, 2, 1, 2, 2, 1, 2]

obj = qt2(dat, group)
printqt2(obj)
#=====

category score
5×1 Named Matrix{Float64}
A ╲ B │   Axis-1
──────┼─────────
x1.1  │  2.31046
x1.2  │ -1.61032
x1.3  │ 0.630126
x2.1  │ 0.630126
x2.2  │ -1.05021

partial correlation coefficient
2×1 Named Matrix{Float64}
A ╲ B │   Axis-1
──────┼─────────
x1    │ 0.612372
x2    │ 0.421464

sample score
8×1 Named Matrix{Float64}
A ╲ B │    Axis-1
──────┼──────────
1     │ -0.420084
2     │   1.26025
3     │ -0.420084
4     │ -0.980196
5     │ -0.980196
6     │   1.26025
7     │ -0.980196
8     │   1.26025

centroids
2×1 Named Matrix{Float64}
A ╲ B │    Axis-1
──────┼──────────
g1    │ -0.793492
g2    │  0.476095

eta
1×1 Named Matrix{Float64}
A ╲ B │   Axis-1
──────┼─────────
eta   │ 0.377778
=====#


x1 = [3, 3, 3, 2, 2, 3, 2, 1];
x2 = [2, 1, 2, 1, 1, 1, 1, 2];
group = [1, 2, 2, 1, 2, 3, 3, 3];
dat = hcat(x1, x2);

obj = qt2(dat, group)
printqt2(obj)
#=====
category score
5×2 Named Matrix{Float64}
A ╲ B │     Axis-1      Axis-2
──────┼───────────────────────
x1.1  │    3.14099    0.267697
x1.2  │  -0.917694     1.19527
x1.3  │ -0.0969778   -0.963377
x2.1  │   0.712515   -0.655608
x2.2  │   -1.18752     1.09268

partial correlation coefficient
2×2 Named Matrix{Float64}
A ╲ B │   Axis-1    Axis-2
──────┼───────────────────
x1    │ 0.630249  0.239844
x2    │ 0.513893  0.203824

sample score
8×2 Named Matrix{Float64}
A ╲ B │    Axis-1     Axis-2
──────┼─────────────────────
1     │   -1.2845   0.129304
2     │  0.615537   -1.61899
3     │   -1.2845   0.129304
4     │ -0.205179   0.539662
5     │ -0.205179   0.539662
6     │  0.615537   -1.61899
7     │ -0.205179   0.539662
8     │   1.95347    1.36038

centroids
3×2 Named Matrix{Float64}
A ╲ B │    Axis-1     Axis-2
──────┼─────────────────────
g1    │ -0.744841   0.334483
g2    │ -0.291382  -0.316673
g3    │  0.787942  0.0936848

eta
1×2 Named Matrix{Float64}
A ╲ B │    Axis-1     Axis-2
──────┼─────────────────────
eta   │  0.403355  0.0688667
=====#
plotqt2(obj)
plotqt2(obj, which="barplot")
plotqt2(obj, which="categoryscore") # savefig("fig1.png")

using RDatasets
iris = dataset("datasets", "iris");
data = Matrix(iris[:, 1:4]);
group = vcat(repeat([1], 50), repeat([2], 50), repeat([3], 50)...);

for i = 1:4
    q = quantile(data[:, i])
    for k = 1:150
        x = data[k, i]
        for j = 2:5
            if x <= q[j]
                data[k, i] = j-1
                break
            end
        end
    end
end
obj = qt2(Int.(data), group)
color = vcat(repeat([:blue], 50), repeat([:black], 50), repeat([:red], 50)...);
plotqt2(obj, color=color) # savefig("fig2.png")
コメント
  • X
  • Facebookでシェアする
  • はてなブックマークに追加する
  • LINEでシェアする

Julia の小ネタ--022 5 ^ 100000000 の,各位の数字の和

2021年04月27日 | ブログラミング


5 ^ 100000000 の,各位の数字の和はいくつか?

5 ^ 3 なら,5 * 5 * 5 = 125 だから,1 + 2 + 5 = 8 ということだ。


答えは,下へスクロール


sum([parse(Int, s) for s in string.(big"5" ^ 3)]) # 8
sum([parse(Int, s) for s in string.(big"5" ^ 100000000)]) # 314531365

コメント
  • X
  • Facebookでシェアする
  • はてなブックマークに追加する
  • LINEでシェアする

Julia に翻訳--203 数量化 I 類

2021年04月27日 | ブログラミング

#==========
Julia の修行をするときに,いろいろなプログラムを書き換えるのは有効な方法だ。
以下のプログラムを Julia に翻訳してみる。

数量化 I 類
http://aoki2.si.gunma-u.ac.jp/R/qt1.html

ファイル名: qt1.jl  関数名: qt1, printqt1, plotqt1

翻訳するときに書いたメモ

==========#

using Statistics, StatsBase, Rmath, LinearAlgebra, NamedArrays, Plots

function qt1(dat, y; vnames=[], vnamey="")
    dat = hcat(dat, y)
    nc, p = size(dat)
    ncat = p - 1
    length(vnames) > 0 || (vnames = ["x$i" for i = 1:ncat])
    vnamey != "" || (vnamey = "dep. var.")
    mx = [maximum(dat[:, i]) for i = 1:ncat]
    start = vcat(0, cumsum(mx)[1:ncat - 1])
    nobe = sum(mx)
    x = zeros(nc, nobe - ncat + 1)
    for i = 1:nc
        x0 = []
        for j = 1:ncat
            zeros0 = zeros(mx[j])
            zeros0[dat[i, j]] = 1
            append!(x0, zeros0[2:end])
        end
        x[i, :] = vcat(x0, dat[i, end])
    end
    a = cov(x)
    ndim = nobe - ncat
    B = a[1:ndim, 1:ndim] \ a[ndim + 1, 1:ndim]
    m = mean(x, dims=1)
    constant = m[ndim + 1] - (m[1:ndim]' * B)
    predicted = x[:, 1:ndim] * B .+ constant
    observed = x[:, ndim + 1]
    residuals = observed .- predicted
    s = sum(x, dims=1)
    en = 0
    coef = []
    coefnames = []
    for i = 1:ncat
        st = en + 1
        en = st + mx[i] - 2
        target = st:en
        tempmean = (s[target]' * B[target]) / nc
        constant = constant + tempmean
        append!(coef, -tempmean, B[target] .- tempmean)
        append!(coefnames, ["$(vnames[i]).$j" for j = 1:mx[i]])
    end
    append!(coef, constant)
    append!(coefnames, ["constant"])
    q = ["a", "b"]
    par = zeros(nc, ncat)
    for j in 1:nc
        en = 0
        for i in 1:ncat
            st = en + 1
            en = st + mx[i] - 2
            target = st:en
            par[j, i] = x[j, target]' * B[target]
        end
    end
    par = hcat(par, observed)
    r = cor(par)
    i = inv(r)
    d = diag(i)
    partialcor = (-i ./ sqrt.(d * d'))[ncat + 1, 1:ncat]
    partialt = abs.(partialcor) .* sqrt.((nc - ncat - 1) ./ (1 .- partialcor .^ 2))
    partialp = pt.(partialt, nc - ncat - 1, false) .* 2
    Dict(:coef => coef, :coefnames => coefnames,
         :r => r, :partialcor => partialcor, :partialt => partialt,
         :partialp => partialp, :predicted => predicted,
         :observed => observed, :residuals => residuals,
         :vnames => vnames, :vnamey => vnamey)
end

function printqt1(obj)
    println("\ncategory score\n", NamedArray(reshape(obj[:coef], :, 1),
        (obj[:coefnames], ["category score"])))
    names = vcat(obj[:vnames], obj[:vnamey])
    println("\ncorrelation coefficient\n", NamedArray(obj[:r], (names, names)))
    println("\npartial correlation coeficiennt\n",
        NamedArray(hcat(obj[:partialcor], obj[:partialt], obj[:partialp]),
        (obj[:vnames], ["partial corr.", "t value", "p value"])))
    println("\nprediction\n",
        NamedArray(hcat(obj[:observed], obj[:predicted], obj[:residuals]),
        (1:length(obj[:observed]), ["observed", "predicted", "residuals"])))
end

function plotqt1(obj; which = "categoryscore") # or "fitness"
    pyplot()
    if which == "categoryscore"
        coefficients = obj[:coef][end-1:-1:1]
        plt = bar(coefficients, orientation=:h, grid=false,
                  yshowaxis=false, yticks=false,
                  xlabel="category score", label="")
        cname = [" $s " for s in obj[:coefnames][end-1:-1:1]]
        align = [c > 0 ? :right : :left for c in coefficients]
        annotate!.(0, 1:length(cname), text.(cname, align, 8))
        vline!([0], color=:black, label="")
    else
        minx, maxx = extrema(vcat(obj[:predicted], obj[:observed]))
        w = 0.05(maxx - minx)
        minx -= w
        maxx += w
        plt = scatter(obj[:predicted], obj[:observed], grid=false,
                      tick_direction=:out, xlabel = "predicted",
                      ylabel = "observed", aspect_ratio = 1,
                      lims=(minx, maxx), size=(600, 600), label="")
        plot!([minx, maxx], [minx, maxx], label="")
    end
    display(plt)
end

dat = [ 1  2  2
        3  2  2
        1  2  2
        1  1  1
        2  3  2
        1  3  3
        2  2  2
        1  1  1
        3  2  2
        1  1  2];
y = [6837, 7397, 7195, 6710, 6670, 6279, 6601, 4929, 5471, 6164];
obj = qt1(dat, y)
printqt1(obj)
#=====

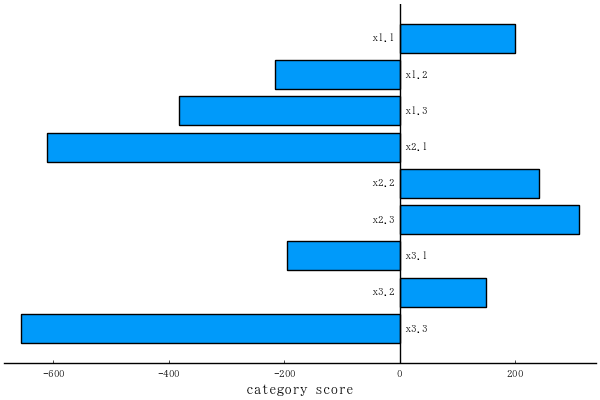
category score
10×1 Named Matrix{Any}
   A ╲ B │ category score
─────────┼───────────────
x1.1     │          199.4
x1.2     │         -215.6
x1.3     │         -382.6
x2.1     │         -610.2
x2.2     │          241.8
x2.3     │          310.8
x3.1     │         -195.0
x3.2     │          149.5
x3.3     │         -656.5
constant │         6425.3

correlation coefficient
4×4 Named Matrix{Float64}
    A ╲ B │        x1         x2         x3  dep. var.
──────────┼───────────────────────────────────────────
x1        │       1.0  -0.510664  -0.463184  -0.103277
x2        │ -0.510664        1.0   0.164788   0.440587
x3        │ -0.463184   0.164788        1.0   0.290518
dep. var. │ -0.103277   0.440587   0.290518        1.0

partial correlation coeficiennt
3×3 Named Matrix{Float64}
A ╲ B │ partial corr.        t value        p value
──────┼────────────────────────────────────────────
x1    │      0.308748       0.795121       0.456835
x2    │      0.500942        1.41777       0.206039
x3    │      0.358395       0.940354       0.383335

prediction
10×3 Named Matrix{Float64}
A ╲ B │     observed     predicted     residuals
──────┼─────────────────────────────────────────
1     │       6837.0        7016.0        -179.0
2     │       7397.0        6434.0         963.0
3     │       7195.0        7016.0         179.0
4     │       6710.0        5819.5         890.5
5     │       6670.0        6670.0           0.0
6     │       6279.0        6279.0           0.0
7     │       6601.0        6601.0  -9.09495e-13
8     │       4929.0        5819.5        -890.5
9     │       5471.0        6434.0        -963.0
10    │       6164.0        6164.0  -9.09495e-13
=====#

plotqt1(obj) # savefig("fig1.png")


plotqt1(obj, which="fitness") # savefig("fig2.png")

コメント
  • X
  • Facebookでシェアする
  • はてなブックマークに追加する
  • LINEでシェアする

Julia の小ネタ--021 二次方程式の解,長精度

2021年04月27日 | ブログラミング

二次方程式の解を求める - R の場合 であるが,Julia だと big を使って以下のようになる。


julia> b = big"1.0000000000000001"
1.000000000000000099999999999999999999999999999999999999999999999999999999999997

julia> c = big"0.0000000000000001"
1.000000000000000000000000000000000000000000000000000000000000000000000000000002e-16

julia> x1 = (-b - sqrt(b^2 - 4*c)) / 2
-1.0

解の公式で求めると,若干の誤差が出る

julia> x2 = (-b + sqrt(b^2 - 4*c)) / 2
-1.000000000000000000000000000000000000000000000000000000000000008567829433725644e-16

解と係数の関係から求めると,十分な精度である

julia> x3 = c / x1

-1.000000000000000000000000000000000000000000000000000000000000000000000000000002e-16

julia> println(x1)
-1.0

julia> println(x2)
-1.000000000000000000000000000000000000000000000000000000000000008567829433725644e-16

julia> println(x3)
-1.000000000000000000000000000000000000000000000000000000000000000000000000000002e-16

いずれにしても,Float64 の範囲では,十分な精度が保証される。

julia> println(Float64(x1))
-1.0

julia> println(Float64(x2))
-1.0e-16

julia> println(Float64(x3))
-1.0e-16


コメント
  • X
  • Facebookでシェアする
  • はてなブックマークに追加する
  • LINEでシェアする

Julia の小ネタ--020 べき乗のべき乗,大きさの見積,長精度

2021年04月26日 | ブログラミング

「べき乗のべき乗」の大きさの見積 であるが,Julia の big 型を使えば以下のようになる

注意点は big(9.8)  などとせず,big"9.8" のように文字型を使って定義するところ。

julia> x = big"4.5"
4.5

julia> y = big"6.7"
6.699999999999999999999999999999999999999999999999999999999999999999999999999972

julia> z = big"9.8"
9.800000000000000000000000000000000000000000000000000000000000000000000000000028

julia> x^y^z
8.141852291891192175294360390819933153170222320673963475352901403217459199966931e+81393094

julia> x = big"2.1"
2.099999999999999999999999999999999999999999999999999999999999999999999999999986

julia> y = big"7.2"
7.199999999999999999999999999999999999999999999999999999999999999999999999999972

julia> z = big"3.6"
3.599999999999999999999999999999999999999999999999999999999999999999999999999986

julia> x^y^z
1.384119872013753626430173206328153257960203418740675402484696742668262448719525e+393


コメント
  • X
  • Facebookでシェアする
  • はてなブックマークに追加する
  • LINEでシェアする

PVアクセスランキング にほんブログ村

PVアクセスランキング にほんブログ村