#==========
Julia の修行をするときに,いろいろなプログラムを書き換えるのは有効な方法だ。
以下のプログラムを Julia に翻訳してみる。
数量化 III 類
http://aoki2.si.gunma-u.ac.jp/R/qt3.html
ファイル名: qt3.jl 関数名: qt3, printqt3, plotqt3
翻訳するときに書いたメモ
==========#
using Rmath, LinearAlgebra, NamedArrays, Plots
function qt3(dat; vname=[], cname=[])
nc, item = size(dat)
if any(dat .>= 3)
length(vname) > 0 || (vname = ["x$i" for i = 1:item])
cat = vec(maximum(dat, dims=1))
nobe = sum(cat)
dat2 = zeros(Int, nc, nobe)
for i = 1:nc
x0 = []
for j = 1:item
zeros0 = zeros(cat[j])
zeros0[dat[i, j]] = 1
append!(x0, zeros0)
end
dat2[i, :] = x0
end
if length(cname) == 0
cname = []
for i = 1:item
append!(cname, ["$(vname[i]).$j" for j = 1:cat[i]])
end
end
else
length(cname) > 0 || (cname = ["Cat-$i" for i = 1:item])
dat2 = dat
end
nobe = size(dat2, 2)
ncc = sum(dat2, dims=2)
ni = vec(sum(dat2, dims=1))
any(ncc .== 0) && error("反応が0のケースがあります")
any(ni .== 0) && error("反応が0のカテゴリーがあります")
fnorm = sum(ni)
x = zeros(nobe, nobe)
for i = 1:nc
x += (dat2[i, :] * dat2[i, :]') / ncc[i]
end
values, vectors = eigen(x ./ sqrt.(ni * ni'), sortby=x-> -x)
ne = sum(values .> 1e-5)
axisname = ["Axis-$i" for i = 1:ne-1]
values = values[2:ne]
vectors = vectors .* sqrt.(fnorm ./ ni)
corr = sqrt.(values)
catscore = vectors[:, 2:ne]
smpscore = dat2 * catscore ./ (ncc * sqrt.(values)')
Dict(:nc => nc, :Eigenvalue => values, :Correlationcoefficient => corr,
:Categoryscore => catscore, :Samplescore => smpscore,
:vname => vname, :cname => cname, :axisname => axisname)
end
function printqt3(obj)
axisname = obj[:axisname]
println("\n", NamedArray(hcat(obj[:Eigenvalue], obj[:Correlationcoefficient])',
(["Eigenvalue", "Correlation coefficient"], axisname)))
println("\nCatrgory score\n", NamedArray(obj[:Categoryscore], (obj[:cname], axisname)))
println("\nSample score\n", NamedArray(obj[:Samplescore],
(1:obj[:nc], axisname)))
end
function plotqt3(obj; axis1 = 1, axis2 = 2, xlabel = "", ylabel = "",
which = "categoryscore", annotate = true) # or "samplescore"
length(obj[:Eigenvalue]) == 1 && error("解が一次元なので,二次元表示はできません。")
if which == "categoryscore"
dat = obj[:Categoryscore]
label = obj[:cname]
else
dat = obj[:Samplescore]
label = 1:obj[:nc]
end
label = [" $l" for l in label]
axisname = obj[:axisname]
xlabel == "" && (xlabel = axisname[axis1])
ylabel == "" && (ylabel = axisname[axis2])
x = dat[:, axis1]
y = dat[:, axis2]
plt = scatter(x, y, grid=false, tick_direction = :out,
color = :black, xlabel = xlabel, ylabel = ylabel, label = "")
annotate == true && annotate!.(x, y, text.(label, 8, :left))
display(plt)
end
dat = [
1 2 3
3 2 1
2 3 1
1 2 3
2 1 2
2 3 2
]
obj = qt3(dat)
printqt3(obj)
#=====
2×4 Named Adjoint{Float64, Matrix{Float64}}
A ╲ B │ Axis-1 Axis-2 Axis-3 Axis-4
────────────────────────┼───────────────────────────────────────
Eigenvalue │ 0.932531 0.598608 0.361922 0.106938
Correlation coefficient │ 0.965677 0.773698 0.6016 0.327013
Catrgory score
9×4 Named Matrix{Float64}
A ╲ B │ Axis-1 Axis-2 Axis-3 Axis-4
──────┼───────────────────────────────────────────
x1.1 │ -1.24668 0.909671 0.370592 -0.22888
x1.2 │ 0.994342 0.185732 0.338808 -0.384332
x1.3 │ -0.489673 -2.37654 -1.75761 1.61076
x2.1 │ 1.1832 1.23348 -2.56331 -1.94775
x2.2 │ -0.994342 -0.185732 -0.338808 0.384332
x2.3 │ 0.899914 -0.338144 1.78987 0.397375
x3.1 │ 0.114108 -1.70558 0.188063 -1.47834
x3.2 │ 1.13257 0.795906 -0.558655 1.70722
x3.3 │ -1.24668 0.909671 0.370592 -0.22888
Sample score
6×4 Named Matrix{Float64}
A ╲ B │ Axis-1 Axis-2 Axis-3 Axis-4
──────┼───────────────────────────────────────────────
1 │ -1.20389 0.703811 0.222948 -0.0748468
2 │ -0.472866 -1.83872 -1.05738 0.526739
3 │ 0.693249 -0.80048 1.28365 -1.49361
4 │ -1.20389 0.703811 0.222948 -0.0748468
5 │ 1.14259 0.954344 -1.54209 -0.63694
6 │ 1.0448 0.277237 0.869913 1.7535
=====#
catdat = [
1 0 0 0 1 0 0 0 1
0 0 1 0 1 0 1 0 0
0 1 0 0 0 1 1 0 0
1 0 0 0 1 0 0 0 1
0 1 0 1 0 0 0 1 0
0 1 0 0 0 1 0 1 0 ];
obj2 = qt3(catdat)
printqt3(obj2)
#=====
2×4 Named Adjoint{Float64, Matrix{Float64}}
A ╲ B │ Axis-1 Axis-2 Axis-3 Axis-4
────────────────────────┼───────────────────────────────────────
Eigenvalue │ 0.932531 0.598608 0.361922 0.106938
Correlation coefficient │ 0.965677 0.773698 0.6016 0.327013
Catrgory score
9×4 Named Matrix{Float64}
A ╲ B │ Axis-1 Axis-2 Axis-3 Axis-4
──────┼───────────────────────────────────────────
Cat-1 │ -1.24668 0.909671 0.370592 -0.22888
Cat-2 │ 0.994342 0.185732 0.338808 -0.384332
Cat-3 │ -0.489673 -2.37654 -1.75761 1.61076
Cat-4 │ 1.1832 1.23348 -2.56331 -1.94775
Cat-5 │ -0.994342 -0.185732 -0.338808 0.384332
Cat-6 │ 0.899914 -0.338144 1.78987 0.397375
Cat-7 │ 0.114108 -1.70558 0.188063 -1.47834
Cat-8 │ 1.13257 0.795906 -0.558655 1.70722
Cat-9 │ -1.24668 0.909671 0.370592 -0.22888
Sample score
6×4 Named Matrix{Float64}
A ╲ B │ Axis-1 Axis-2 Axis-3 Axis-4
──────┼───────────────────────────────────────────────
1 │ -1.20389 0.703811 0.222948 -0.0748468
2 │ -0.472866 -1.83872 -1.05738 0.526739
3 │ 0.693249 -0.80048 1.28365 -1.49361
4 │ -1.20389 0.703811 0.222948 -0.0748468
5 │ 1.14259 0.954344 -1.54209 -0.63694
6 │ 1.0448 0.277237 0.869913 1.7535
=====#
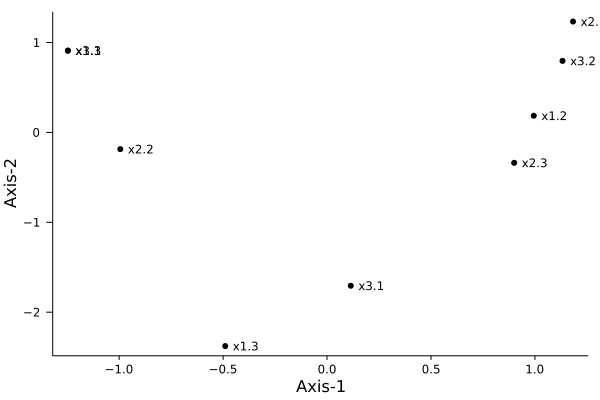
plotqt3(obj); savefig("fig1.png")
plotqt3(obj, which="samplescore"); savefig("fig2.png")


