wind rose(風配図)は cockscomb(鶏頭図)と似ているが,wind rose はおうぎ形の幅が狭く,棒グラフのように*概ね*半径が量を表すと見なせるので,ちょっと違いがある。また,本来は風向・風速を表示するものなので,角度(方向)に意味がある(北風,北北西の風など)ので,これは棒グラフにするよりはそのままの方がわかりやすいであろう(360度は0度に連続するから)。

wind rose(風配図)は cockscomb(鶏頭図)と似ているが,wind rose はおうぎ形の幅が狭く,棒グラフのように*概ね*半径が量を表すと見なせるので,ちょっと違いがある。また,本来は風向・風速を表示するものなので,角度(方向)に意味がある(北風,北北西の風など)ので,これは棒グラフにするよりはそのままの方がわかりやすいであろう(360度は0度に連続するから)。

誤解してはいけない。
ナイチンゲールの鶏頭図は,正しいのだよ(^_^;)
ナイチンゲールの鶏頭図(コウモリの翼)はボンヤリとした画像だなあぐらいにしか思っていない人が多い。

左下に注釈が書いてあるが,明確に "The areas of the blue, red, & black wedges are each measured from the centre as the common vertex." と書かれている。つまり,(中心からの)おうぎ形の面積が量を表すと書いてある。
疑り深い人の為に,この記事の最後に,元のデータがあるので自分で確かめるとよい。
右側の図(1854/04 ~ 1855/03)を R で描いてみる。
df = read.csv("FN.csv")
df$r.diseases = df$diseases / df$total * 12000
df$r.wounds = df$wounds / df$total * 12000
df$r.others = df$others / df$total * 12000
df1 = df[1:12, 7:9]
df1
begin = seq(180, -210, by = -30)
old = par(mar = c(0, 0, 0, 0))
plot(c(-26, 18), c(-32, 16),
type = "n", bty = "n", asp = 1, xlab = "", ylab = "", axes = FALSE)
color = c("aliceblue", "pink", "gray")
for (i in 1:12) {
deg = seq(begin[i], begin[i+1], length.out = 1000) / 180 * pi
for (j in order(df1[i,], decreasing = TRUE)) { # df1[12,] はバグだった
r = sqrt(df1[i, j])
x = c(0, r * cos(deg))
y = c(0, r * sin(deg))
polygon(x, y, col = color[j])
}
}
面積が量を表すということであるから,半径は量の平方根であるということを r = sqrt(df1[i, j]) で指定している。
できあがった図は以下のようになり,ナイチンゲールが描いたものと同じになっている。

さて,鶏頭図はナイチンゲールが最初に発明したものではないという話もあるが,上の図は本当に見やすいだろうか?人間は量を面積で把握する力は低い。それでも「水色の部分がおおきいでしょ!」というナイチンゲールの主張は十分に明確なのだけど,下のような図の方がもっと声高く主張しているのがわかる。

Zymotic diseases は 1855 Jan に最も死亡率が高く 1022.8 である。そのときの Wounds & injuries は 30.7 である。前者は後者の 33 倍である。
鶏頭図の面積を比較して,面積比が 33 倍になっていることを理解することができるだろうか?折れ線グラフだとどうだろうか?
ナイチンゲールの元データ。
Mon Year total diseases wounds others r.diseases r.wounds r.others
1 4 1854 8571 1 0 5 1.400070 0.0000000 7.000350
2 5 1854 23333 12 0 9 6.171517 0.0000000 4.628638
3 6 1854 28333 11 0 6 4.658878 0.0000000 2.541206
4 7 1854 28772 359 0 23 149.728903 0.0000000 9.592660
5 8 1854 30246 828 1 30 328.506249 0.3967467 11.902400
6 9 1854 30290 788 81 70 312.182238 32.0897986 27.731925
7 10 1854 30643 503 132 128 196.978103 51.6920667 50.125640
8 11 1854 29736 844 287 106 340.597256 115.8192090 42.776433
9 12 1854 32779 1725 114 131 631.501876 41.7340370 47.957534
10 1 1855 32393 2761 83 324 1022.813571 30.7473837 120.025932
11 2 1855 30919 2120 42 361 822.795045 16.3006566 140.108024
12 3 1855 30107 1205 32 172 480.286976 12.7545089 68.555485
13 4 1855 32252 477 48 57 177.477366 17.8593576 21.207987
14 5 1855 35473 508 49 37 171.849012 16.5759874 12.516562
15 6 1855 38863 802 209 31 247.639143 64.5343900 9.572087
16 7 1855 42647 382 134 33 107.487045 37.7048796 9.285530
17 8 1855 44614 483 164 25 129.914377 44.1117138 6.724347
18 9 1855 47751 189 276 20 47.496388 69.3598040 5.026073
19 10 1855 46852 128 53 18 32.784086 13.5746606 4.610262
20 11 1855 37853 178 33 32 56.428817 10.4615222 10.144506
21 12 1855 43217 91 18 28 25.267834 4.9980332 7.774718
22 1 1856 44212 42 2 48 11.399620 0.5428390 13.028137
23 2 1856 43485 24 0 19 6.622973 0.0000000 5.243187
24 3 1856 46140 15 0 35 3.901170 0.0000000 9.102731
> 鶏頭図(PolarAreaChart)は円グラフと似ていますが、セグメントの角度は同じです。 代わりにセグメントの半径が値によって異なります。
間違いです。
二次元グラフになりますので,半径で値を表すのではなく,面積で値を表さないといけません。
つまり,半径は値の平方根を取ったものでなければならないのです。

これは,ggplot が悪いんじゃなくて,使った人がうっかりさん。
> 最後に、グラフの外観なんかも帰れたりします。「theme」という関数があって、それで変更します。
#normal p1=ggplot(diamonds2,aes(carat,price,colour=color))+geom_point() #bold grid p2=ggplot(diamonds2,aes(carat,price,colour=color))+geom_point()+theme(panel.grid=element_line(size=2)) #white-black theme p3=ggplot(diamonds2,aes(carat,price,colour=color))+geom_point()+theme_bw() #use ggtheme library(ggthemes) p4=ggplot(diamonds2,aes(carat,price,colour=color))+geom_point()+theme_wsj() grid.arrange(p1,p2,p3,p4,nrow=2)
左の図が正しくて,右が間違い。右のグラフはおうぎ形の半径が量を表している。二次元なんだから面積が量を表すようにしないと,間違った印象を与えるグラフになる(つまり,量の平方根を半径としておうぎ形を描きなさいということ)
見た目が派手(素人受けする)だからといって安易に外観を選んじゃダメ。

折れ線グラフ
左は ggplot をほとんどデフォルトのまま描いたもの
右は base の matplot を使って描いたもの

library(ggplot2)
library(ggsci)
library(reshape2)
x <- matrix(c(120, 118, 123, 120, 121, 119, 118, 121, 120, 120,
121, 135, 145, 158, 173, 184, 198, 214, 209, 212,
121, 130, 141, 148, 157, 168, 177, 189, 201, 210,
119, 120, 120, 123, 125, 127, 141, 163, 180, 224,
120, 128, 137, 144, 153, 163, 171, 179, 187, 199), ncol = 5)
rownames(x) <- 1:10
colnames(x) <- c("A", "B", "C", "D", "E")
y <- melt(x)
colnames(y) <- c("day", "treat", "weight")
ggplot(y, aes(x = day, y = weight, color = treat)) +
geom_line() +
scale_color_nejm()
matplot を使う場合,y <- melt(x) のような操作は不要である。
old = par(mar = c(3, 3, 0.5, 3), mgp = c(1.8, 0.4, 0))
color = rep("gray", 5)
lwd = rep(1, 5)
color[4] = "red" # 強調のため
lwd[4] = 2 # 強調のため
delta.pos = rep(0, 5)
delta.pos[2] = 4 # 凡例位置の調整
delta.pos[3] = -2 # 凡例位置の調整
matplot(x,
type="l", # 折れ線グラフを描く
col = color, # 線の色
lwd = lwd, # 線の太さ
lty = 1, # 線の種類(実線)
tck = -0.02, # ティックマークの長さ
las = 1, # 縦軸目盛りを水平に
xlab = "day", # 横軸の名前
ylab = "weight", # 縦軸の名前
bty = "l") # 枠は描かない
text(11, x[10, ] + delta.pos, paste("treat", LETTERS[1:5], sep = "-"),
col = color, xpd = TRUE)
par(old)
もうね,一杯あるので,番号付けない
全部「ggplot を「けなしまくる」スレッド」
まずは,「ggplot2 まとめ: 初歩から程よいレベルまで」に描かれていることだけど
> ggplot(data=iris,aes(x=Sepal.Length,y=Sepal.Width))+ #キャンバス用意。使うデータ宣言。aes()の中でx軸とy軸指定。
+ geom_point()+ #キャンバスに散布図を上書き
+ geom_smooth()+ #さらに回帰線を上書き
+ theme_bw() #白を基調としたグリッド線の設定セットを上書き
描かれた図がこれ
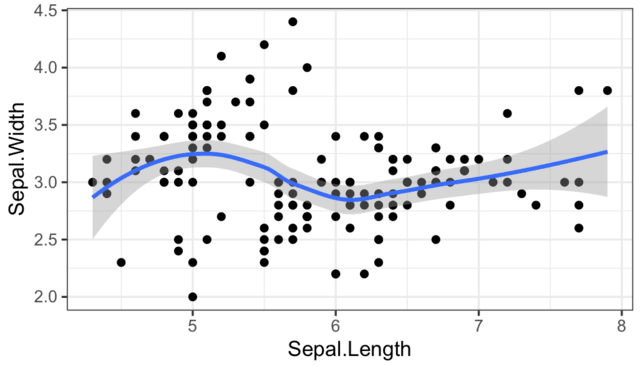
これで何がわかる?
逆に言えば,何かがわかるために描いた図ではないということ
geom_smooth() って,なんの必要性があるのやら
どうすればいいかって?
そんなの知らない!! サジを投げる
続いて,
> ggplot(iris,aes(x=Petal.Length))+ geom_histogram()

なんだこりゃ。2つのグループがあるように見えるけど。実際は 3 つのぐるーぷがあるんだよおおお〜〜〜。
まだあるようだけど,もういいわ
まあ,とにかく ggplot がいやなんです。自分で使うなんてもってのほかで,ほかの人が使っているのを見るのもいや。
「ほかの人が使っているのなんかいいじゃないか!!」と,普通の人は思うでしょうが,私は,断固!!いやなんです!!!
統計リテラシーに問題があると思うんです!!!
まずは,
いや,いいんですよ,デフォルトじゃなくて,灰色が普通の白(または透化),グリッドも描かないという人は
でも,その他のデフォルトも,「いや〜〜ん」なことも多いのでは?
みなさん,「いや〜〜ん」だったことありませんか?
告発お待ちしてます(^_^;)
ggplot のヒストグラムですが,他と同じく,デフォルトで使うとひどい目に遭います(ひどい目に遭ったことにも気づかないほどのひどい目です)。
いつものように,るんるん気分で,データフレーム df にある変数 x のヒストグラムを描いてみます。
df <- data.frame(value = x)
ggplot(df, aes(x = value)) + geom_histogram()

「おやまあ,なんか変な分布だなあ」ぐらいに思い,
警告: Ignoring unknown parameters: bin
`stat_bin()` using `bins = 30`. Pick better value with `binwidth`.
なんて,警告(!!)も出ていることだからと,「まあ,bins = 12 ぐらいで何とかなるか?」
df <- data.frame(value = x)
ggplot(df, aes(x = value)) + geom_histogram(bins = 12)

「ふーんそうか」で終わらせてしまう...
========================
同じデータを graphics:::hist で描く(デフォルトで)
hist(df$value)

「あれ,ずいぶんと整然としたデータ」
実はこのデータ,
x = rep(0:10, c(1,2,3,4,5,6,5,4,3,2,1))
set.seed(123456)
x = x + runif(length(value), 0.01, 0.99)
として作られたもの。
> x
[1] 0.7918286 1.7484938 1.3934306 2.3447256 2.3640682 2.2043778 3.5341608
[8] 3.1045957 3.9780900 3.1742181 4.7920293 4.5919181 4.8972038 4.8732317
[15] 4.9839598 5.8880372 5.8710705 5.2036536 5.3382937 5.7716622 5.1664017
[22] 6.0890323 6.1399973 6.1784673 6.4782223 6.6964947 7.8722913 7.8702378
[29] 7.8468020 7.1726678 8.5225094 8.8617456 8.2365336 9.1266993 9.8174722
[36] 10.0886714
> as.integer(x) # 小数点以下を切り捨てると,0 ~ 10 の数になる
[1] 0 1 1 2 2 2 3 3 3 3 4 4 4 4 4 5 5 5 5 5 5 6 6 6 6
[26] 6 7 7 7 7 8 8 8 9 9 10
> table(as.integer(x)) # 0以上 1未満,1以上 2未満... と集計すると
0 1 2 3 4 5 6 7 8 9 10
1 2 3 4 5 6 5 4 3 2 1
じゃあ,というので ggplot がリターンマッチ。
ggplot(df, aes(x = as.integer(value))) + geom_histogram(bins = 12)
とやったら,とんでもないものが描けた。

はい,終了!終了!!
他のまともなデータならこんなことはない(といいのだけれど)
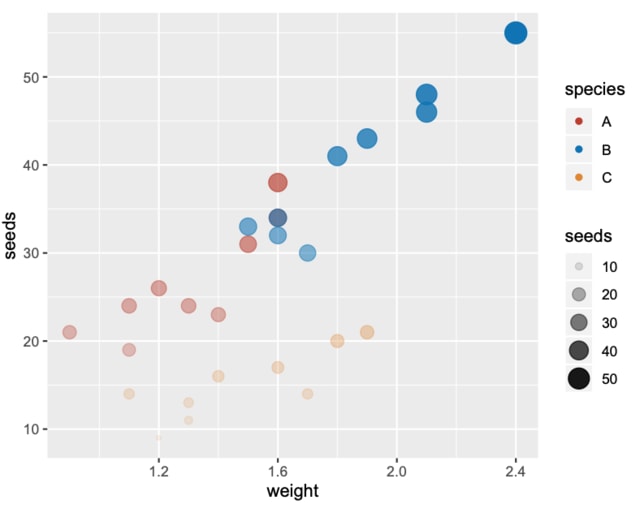
ggplot を使ったグラフ例でよくあるのは,以下の図はまだましだが,グラフのサイズがデフォルトのままで,中の文字が「小さすぎて読めな〜〜〜いっ(はずきるーぺもってこ〜〜い」状態のもの。
なお,以下のグラフの問題点は数多く。
library(ggplot2)
library(ggsci)
A <- data.frame(
weight = c(1.2, 1.5, 1.1, 1.6, 1.6, 1.4, 1.3, 0.9, 1.1),
seeds = c(26, 31, 19, 34, 38, 23, 24, 21, 24)
)
B <- data.frame(
weight = c(1.6, 1.7, 1.8, 1.6, 1.5, 1.9, 2.1, 2.1, 2.4),
seeds = c(32, 30, 41, 34, 33, 43, 46, 48, 55)
)
C <- data.frame(
weight = c(1.1, 1.3, 1.6, 1.3, 1.2, 1.9, 1.8, 1.4, 1.7),
seeds = c(14, 13, 17, 11, 9, 21, 20, 16, 14)
)
x <- rbind(data.frame(species = "A", A),
data.frame(species = "B", B),
data.frame(species = "C", C))
quartz("ggplot", 3.5, 2.5, bg = "white")
g <- ggplot(x, aes(x = weight, y = seeds, size = seeds, alpha = seeds, color = species))
g <- g + geom_point()
g <- g + scale_color_nejm()
print(g)

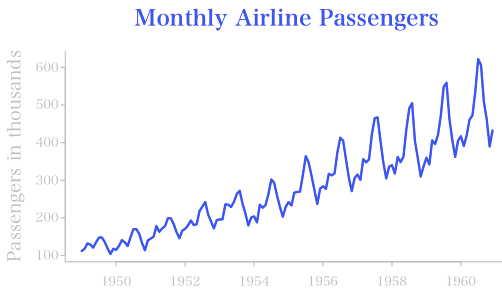
「ggplot では,容易にエラーバーのついた折れ線グラフが描けます!」っていうけど,
ggplot のエラーバーグラフは,エラーバーの横線が長すぎる。
ところで,そのエラーバーは標準偏差なの標準誤差なのそれともそれ以外?それを明示しないと読者を惑わす(書いてあっても,ただしく理解してもらえるかどうか怪しい)。
この図は mean ± sd で描いたもの。
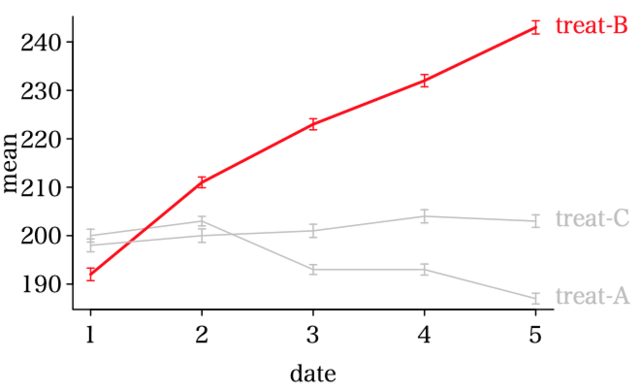
R だって,エラーバー描画は arrows 関数を加えるだけで「簡単に書ける」。

以下の図は,mean ± se で描いたもの。
se = sd / sqrt(サンプルサイズ)
エラーバーの長さは,サンプルサイズが 10 でも当然だが 1/sqrt(10) ≒ 0.3 倍(ほぼ 1/3)になる。
library(ggplot2)
library(ggsci)
x <- data.frame(
date = c(1, 2, 3, 4, 5,
1, 2, 3, 4, 5,
1, 2, 3, 4, 5),
treat = c("A", "A", "A", "A", "A",
"B", "B", "B", "B", "B",
"C", "C", "C", "C", "C"),
mean = c(200, 203, 193, 193, 187,
192, 211, 223, 232, 243,
198, 200, 201, 204, 203),
sd = c(4.2, 3.1, 3.2, 3.6, 3.5,
4.1, 3.5, 3.6, 4.0, 4.3,
4.2, 4.4, 4.3, 4.3, 4.1)
)
ggplot(x, aes(x = date, y = mean, color = treat)) +
geom_line() +
scale_color_nejm() +
geom_errorbar(aes(ymin = mean - sd, ymax = mean + sd, width = 0.3))
###################
mean = matrix(c(200, 203, 193, 193, 187,
192, 211, 223, 232, 243,
198, 200, 201, 204, 203), ncol = 3)
sd = matrix(c(4.2, 3.1, 3.2, 3.6, 3.5,
4.1, 3.5, 3.6, 4.0, 4.3,
4.2, 4.4, 4.3, 4.3, 4.1), ncol = 3)
n = 10 # サンプルサイズ
err = sd / sqrt(n) # 標準誤差(標準偏差で描きたいときは,上で n = 1 とする)
g = ncol(mean) # 群数
d = nrow(mean) # 日数
old = par(mar = c(3, 3, 0.5, 3), mgp = c(1.8, 0.4, 0))
color = rep("gray", g)
lwd = rep(1, g)
color[2] = "red"
lwd[2] = 2
matplot(mean,
type="l",
col = color, # 色
lwd = lwd, # 太さ
lty = 1, # 線種
tck = -0.02, # ティックマークの長さ
las = 1, # 縦軸目盛りを水平に
xlab = "date",
ylab = "mean",
bty = "l") # 枠は描かない
arrows(1:d, mean - err, 1:d, mean + err,
length = 0.025, angle = 90, code = 3, col = rep(color, each = d), xpd = TRUE)
text(d + 0.05, mean[d, ], paste("treat", LETTERS[1:g], sep = "-"),
col = color, pos = 4, xpd = TRUE)
par(old)
「geom_smooth 関数を使うと,回帰直線も描き込めるよ!」というが,まあ,散布図の目的のひとつは,データの撒布状況を示すのであるから,回帰直線とその信頼区間を示すよりは確率楕円を描き込むほうがよい場合もあるだろう。
なお,右図は信頼率に 0.8 を使った(0.95 では,サンプルサイズが小さい場合には楕円が大きくなりすぎる)。
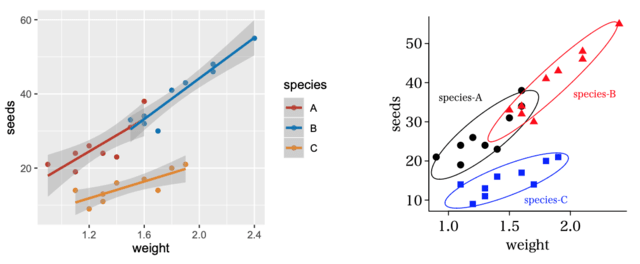
library(ggplot2)
library(ggsci)
A <- data.frame(
weight = c(1.2, 1.5, 1.1, 1.6, 1.6, 1.4, 1.3, 0.9, 1.1),
seeds = c(26, 31, 19, 34, 38, 23, 24, 21, 24)
)
B <- data.frame(
weight = c(1.6, 1.7, 1.8, 1.6, 1.5, 1.9, 2.1, 2.1, 2.4),
seeds = c(32, 30, 41, 34, 33, 43, 46, 48, 55)
)
C <- data.frame(
weight = c(1.1, 1.3, 1.6, 1.3, 1.2, 1.9, 1.8, 1.4, 1.7),
seeds = c(14, 13, 17, 11, 9, 21, 20, 16, 14)
)
x <- rbind(data.frame(species = "A", A),
data.frame(species = "B", B),
data.frame(species = "C", C))
quartz("ggplot", 3.5, 2.5, bg = "white")
g <- ggplot(x, aes(x = weight, y = seeds, color = species))
g <- g + geom_point()
g <- g + geom_smooth(method = "lm")
g <- g + scale_color_nejm()
print(g)
#######################
old = par(mar = c(3, 3, 0.5, 0.5), mgp = c(1.5, 0.4, 0))
x.mark = c(19, 17, 15)[as.integer(x$species)]
color = c("black", "red", "blue")
x.color = color[as.integer(x$species)]
plot(seeds ~ weight, data = x,
pch = x.mark, # マーク種類
col = x.color, # 色
tck = -0.02, # ティックマークの長さ
las = 1, # 縦軸目盛りを水平に
bty = "l") # 枠は描かない
text(c(1.1, 2.2, 1.8), c(36, 37, 10), paste("species", LETTERS[1:3], sep = "-"),
col = color, cex = 0.7)
Species = split(x, x$species)
for (df in Species) {
ellipse.draw(df$weight, df$seeds, alpha = 0.2, border = color[as.integer(df[1, 1])])
}
par(old)
ggplot では作り付けなので geom_smooth(method = "lm") で済むが,base では,自前の楕円描画プログラムを用意しないといけない。
この楕円描画プログラムは「散布図,確率楕円,回帰直線,信頼限界帯,MA regression,RMA regression」にある R プログラムを使用させてもらった。
ellipse.draw <- function(x, y, alpha = 0.05, acc = 2000, border = "black", lty = 1, lwd = 1) {
vx <- var(x)
vy <- var(y)
vxy <- var(x, y)
lambda <- eigen(var(cbind(x, y)))$values
a <- sqrt(vxy^2/((lambda[2] - vx)^2 + vxy^2))
b <- (lambda[2] - vx) * a/vxy
theta <- atan(a/b)
k <- sqrt(-2 * log(alpha))
l1 <- sqrt(lambda[1]) * k
l2 <- sqrt(lambda[2]) * k
x2 <- seq(-l1, l1, length.out = acc)
tmp <- 1 - x2^2/l1^2
y2 <- l2 * sqrt(ifelse(tmp < 0, 0, tmp))
x2 <- c(x2, rev(x2))
y2 <- c(y2, -rev(y2))
s0 <- sin(theta)
c0 <- cos(theta)
xx <- c0 * x2 + s0 * y2 + mean(x)
yy <- -s0 * x2 + c0 * y2 + mean(y)
rngx <- range(c(x, xx))
rngy <- range(c(y, yy))
polygon(xx, yy, lty = lty, lwd = lwd, border = border)
}
ggplot は,凡例は図の外に描く。もっと悪いことには,例え凡例が1個でも描いてしまう。
凡例も,この例のようにある程度点がまとまっているような場合には図中に描く方がわかりやすい。
デフォルトの色の選択も,よく言えば「渋い」が例えばこの図の赤っぽいのとオレンジっぽいのの区別がつきづらい。また,常にカラーで見られるのならこれでもよいが,モノクロコピーの配布物にこの図が入ってしまうとどうなるか。記号の区別は色だけではなく形状も考慮するのがよいであろう。たまたま,中央付近に赤の三角と黒丸が重なっているところがある。ggplot ではほとんど気づかない。
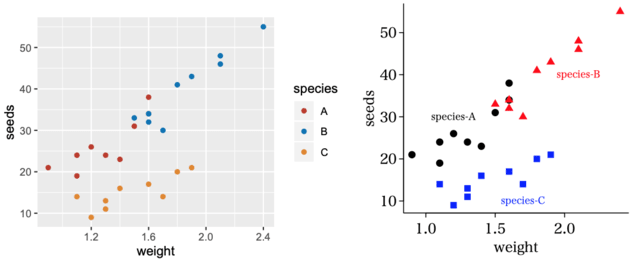
library(ggplot2)
library(ggsci)
A <- data.frame(
weight = c(1.2, 1.5, 1.1, 1.6, 1.6, 1.4, 1.3, 0.9, 1.1),
seeds = c(26, 31, 19, 34, 38, 23, 24, 21, 24)
)
B <- data.frame(
weight = c(1.6, 1.7, 1.8, 1.6, 1.5, 1.9, 2.1, 2.1, 2.4),
seeds = c(32, 30, 41, 34, 33, 43, 46, 48, 55)
)
C <- data.frame(
weight = c(1.1, 1.3, 1.6, 1.3, 1.2, 1.9, 1.8, 1.4, 1.7),
seeds = c(14, 13, 17, 11, 9, 21, 20, 16, 14)
)
x <- rbind(data.frame(species = "A", A),
data.frame(species = "B", B),
data.frame(species = "C", C))
g <- ggplot(x, aes(x = weight, y = seeds, color = species))
g <- g + geom_point()
g <- g + scale_color_nejm()
print(g)
===============
old = par(mar = c(3, 3, 0.5, 0.5), mgp = c(1.5, 0.4, 0))
x.mark = c(19, 17, 15)[as.integer(x$species)] # マークの形状
color = c("black", "red", "blue") # 使用する色
x.color = color[as.integer(x$species)] # マークの色
plot(seeds ~ weight, data = x,
pch = x.mark, # マーク種類
col = x.color, # 色
tck = -0.02, # ティックマークの長さ
las = 1, # 縦軸目盛りを水平に
bty = "l") # 枠は描かない
text(c(1.2, 2.1, 1.7), c(30, 40, 10), paste("species", LETTERS[1:3], sep = "-"),
col = color, cex = 0.7) # 凡例の代わり
par(old)
The Do’s and Don’ts of Chart Making


散布図の比較。他も同じなのだけど,デフォルトでバックグラウンドが灰色で白のグリッド線が入るのは,無用の長物。
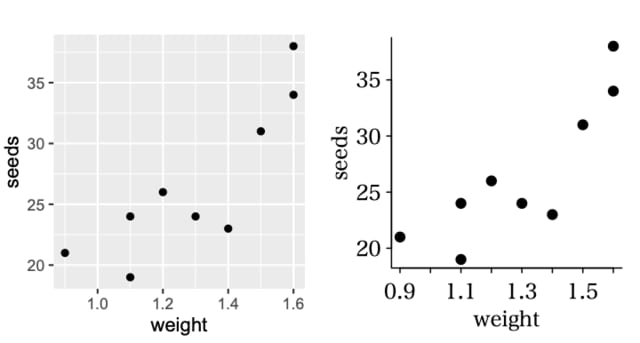
x <- data.frame(
weight = c(1.2, 1.5, 1.1, 1.6, 1.6, 1.4, 1.3, 0.9, 1.1),
seeds = c(26, 31, 19, 34, 38, 23, 24, 21, 24)
)
g <- ggplot(x, aes(x = weight, y = seeds))
g <- g + geom_point()
print(g)
old = par(mar = c(3, 3, 0.5, 0.5), mgp = c(1.5, 0.4, 0))
plot(seeds ~ weight, data = x, # 今の場合は plot(x, でよい
pch = 19, # マーク種類
tck = -0.02, # ティックマークの長さ
las = 1, # 縦軸目盛りを水平に
bty = "l") # 枠は描かない
par(old)