


算額(その383)
番外編 2019 青森公立大学 前期 経営経済学部 第 3 問
https://mathexamtest.web.fc2.com/2019/201911051/2019110510100mj.html#top-0105


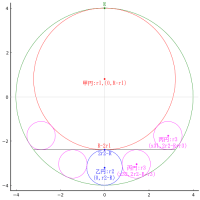
BC を x 軸上に置き,点 B を原点とする。
A の座標 (ax, ay)
B の座標 (0, 0)
C の座標 (cx, 0)
D の座標 (dx, 0)
E の座標 (ex, ey)
外接円の半径と中心座標 R, (ox, oy)
AD*cos(∠BAC) を ADcosθ とおく(使わない)。
AB = 7, CA = 13, R = 13√3/3
以下の 9元連立方程式を解く。
include("julia-source.txt");
using SymPy
@syms ax::positive, ay::positive, cx::positive,
dx::positive, ex::positive, ey::negative,
ox::positive, oy::negative, R::positive,
ADcosθ::poisitive, AD::positive,
AB::positive, CA::positive;
(AB, CA, R) = (7, 13, 13*sqrt(Sym(3))/3)
AD = sqrt((ax - dx)^2 + ay^2)
eq1 = ax^2 + ay^2 - 7^2
eq2 = (cx - ax)^2 + ay^2 - 13^2
eq3 = (ax - ox)^2 + (ay - oy)^2 - R^2
eq4 = ox^2 + oy^2 - R^2
eq5 = (cx- ox)^2 + oy^2 - R^2
eq6 = (ex - ox)^2 + (ey - oy)^2 - R^2
eq7 = dx*13 - AD*sqrt(ex^2 + ey^2)
eq8 = AB^2 + AD^2 - 2*AB*ADcosθ - dx^2
eq9 = CA^2 + AD^2 - 2*CA*ADcosθ - (cx - dx)^2
res = solve([eq1, eq2, eq3, eq4, eq5, eq6, eq7, eq8, eq9], (ax, ay, cx, dx, ex, ey, ox, oy, ADcosθ))
2-element Vector{NTuple{9, Sym}}:
(7/2, 7*sqrt(3)/2, 15, 21/4, 15/2, -9*sqrt(3)/2, 15/2, -sqrt(3)/6, 35/8)
(7/2, 7*sqrt(3)/2, 15, 21/4, 15/2, -9*sqrt(3)/2, 15/2, -sqrt(3)/6, 35/8)
2 組求まったが,全く同じだ。
ax = 3.5; ay = 6.06218; cx = 15; dx = 5.25;
ex = 7.5; ey = -7.79423; ox = 7.5; oy = -0.288675; AD*cos(θ) = 4.375
辺 BC の長さ = 15
線分 AD の長さ = 7*sqrt(13)/4
線分 BE の長さ = 3*sqrt(13)
using Plots
function draw(more=false)
pyplot(size=(500, 500), grid=false, aspectratio=1, label="", fontfamily="IPAMincho")
(ax, ay, cx, dx, ex, ey, ox, oy, ADcosθ) = res[2]
R = 13*sqrt(Sym(3))/3
@printf("ax = %g; ay = %g; cx = %g; dx = %g;\nex = %g; ey = %g; ox = %g; oy = %g; AD*cos(θ) = %g\n",
ax, ay, cx, dx, ex, ey, ox, oy, ADcosθ)
println("辺 BC の長さ = $cx")
println("線分 AD の長さ = $(sqrt((ax - dx)^2 + ay^2))")
println("線分 BE の長さ = $(sqrt(ex^2 + ey^2))")
plot([0, ax, ex, 0, cx, ax], [0, ay, ey, 0, 0, ay], color=:black, lw=0.5)
circle(ox, oy, R)
if more
delta = (fontheight = (ylims()[2]- ylims()[1]) / 500 * 10 * 2) / 3 # size[2] * fontsize * 2
point(ax, ay, "A(ax,ay) ", :green, :right, :bottom)
point(0, 0, "B(0,0) ", :green, :right, :bottom)
point(cx, 0, " C(cx,0)", :green, :left, :bottom)
point(dx, 0, " D(dx,0)", :green, :left, :bottom)
point(ex, ey, " E(ex,ey)", :green, :left, :bottom, delta=1.5delta)
point(ox, oy, " O(ox,oy)", :red)
vline!([0], color=:black, lw=0.5)
hline!([0], color=:black, lw=0.5)
plot!(xlims=(-2, 16))
else
plot!(showaxis=false)
end
end;


※コメント投稿者のブログIDはブログ作成者のみに通知されます