


算額(その1183)
(8) 京都府宮津市天橋立文殊 智恩寺文殊堂 天保8年(1837)
近畿数学史学会:近畿の算額「数学の絵馬を訪ねて」,平成4年5月16日 初版第一刷,大阪教育図書株式会社,大阪市.
キーワード:円5個,正五角形
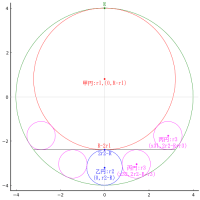
正五角形の中に,正五角形の中心を通り辺に接する円を 5 個描く。円が交わってできる中央部の円弧で囲まれた細長い部分の面積(図の黄色で示した部分)を求めよ。

正五角形の一辺の長さを a とする。
正五角形の中心から辺までの長さを h とする(h = BD)。
求める面積は,「扇形 CAB から三角形 ABC の面積を引いたものの 2*5 倍」である。
include("julia-source.txt");
using SymPy
@syms a, h
a = 10
eq = h*tand(Sym(36)) - (a//2)
ans_h = solve(eq, h)[1]
h2 = ans_h/2
h2 |> println
a/(4*sqrt(5 - 2*sqrt(5)))
三角形 ABC の面積
S1 = h2*cosd(Sym(18))*h2*sind(Sym(18))
S1 |> println
a^2*(-1/4 + sqrt(5)/4)*sqrt(sqrt(5)/8 + 5/8)/(16*(5 - 2*sqrt(5)))
扇形 CAB の面積 = (半径 h2 = BC の円の面積の 1/10)
∠ACB = 36°
S2 = PI*h2^2*(36//360)
S2 |> println
pi*a^2/(160*(5 - 2*sqrt(5)))
S = 10(S2 - S1)
S |> println
-5*a^2*(-1/4 + sqrt(5)/4)*sqrt(sqrt(5)/8 + 5/8)/(8*(5 - 2*sqrt(5))) + pi*a^2/(16*(5 - 2*sqrt(5)))
正五角形の一辺の長さが 10 のとき,求める面積は 2.39960452467531 である。
S(a => 10).evalf() |> println
2.39960452467531
点 A の 座標は以下のとおり。
@syms x0::positive, y0::negative
h2 = 1
eq1 = x0^2 + (y0 + h2)^2 - h2^2
eq2 = (x0 - h2*cosd(54))^2 + (y0 - h2*sind(54))^2 - h2^2
res = solve([eq1, eq2], (x0, y0))
1-element Vector{Tuple{Sym{PyCall.PyObject}, Sym{PyCall.PyObject}}}:
(0.587785252292474, -0.190983005625053)
function fill(h2)
θ = range(54, 90, 10)
x = @. h2*cosd(θ)
y = @. h2*sind(θ)
cx = (x[1] + x[end])/2
cy = (y[1] + y[end])/2
for i in 1:length(x)
append!(x, 2cx - x[i])
append!(y, 2cy - y[i])
end
append!(x, x[1])
append!(y, y[1])
y = @. y - h2
for i = 1:5
plot!(x, y, seriestype=:shape, linecolor=:yellow, fillcolor=:yellow, color=:yellow)
(x, y) = transform(x, y, deg=72)
end
end;
function draw(a, more)
pyplot(size=(500, 500), grid=false, aspectratio=1, label="", fontfamily="IPAMincho")
r = (a/2)/sind(36)
h = (a/2)/tand(36)
h2 = h/2
θ = 18:72:378
x = @. r*cosd(θ)
y = @. r*sind(θ)
plot(x, y, color=:blue, lw=0.5)
circle(0, 0, r, :green)
fill(h2)
rotate(0, -h2, h2, angle=72)
if more
delta = (fontheight = (ylims()[2]- ylims()[1]) / 500 * 10 * 2) /3 # size[2] * fontsize * 2
hline!([0], color=:gray80, lw=0.5)
vline!([0], color=:gray80, lw=0.5)
point(0.588h2, -0.191h2, "A", :black, :left, :bottom, delta=delta/2)
point(0, 0, "B ", :black, :right, :bottom, delta=delta/2)
point(0, -h2, "C", :black, :center, delta=-delta/2)
plot!([0, 0, 0.588h2, 0], [-h2, 0, -0.192h2, -h2], color=:black, lw=0.5)
point(0, -h, "D", :blue, :center, delta=-delta/2)
point(x[4], y[4], "E ", :blue, :right, delta=-delta/2)
end
end;
draw(1, true)


※コメント投稿者のブログIDはブログ作成者のみに通知されます