


Julia では,グラフ作成のためのパッケージが色々あるので,少しずつつまみ食いしている。
GRMalie(Makie) を試してみたが,その中では以下のものが目に止まった。
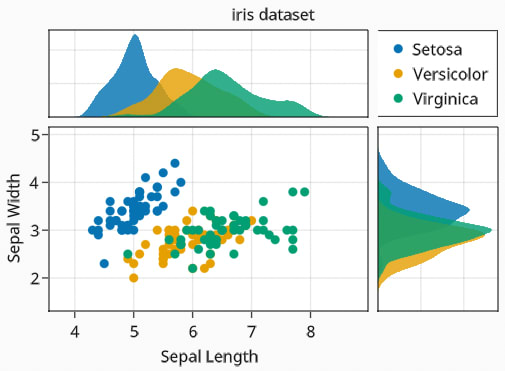
iris データを使って書いてみた。ただし,Makie では,grid を消すことができないそうだ。grid も含めて tick などもまとめて消すことはできるようだが,それでは副作用が大きすぎる。
また,標榜しているほどきれいでもない。
なので,今後も使う予定はない。
using GLMakie
using FileIO
using ColorTypes
using RDatasets
noto_sans = assetpath("fonts", "NotoSans-Regular.ttf")
noto_sans_bold = assetpath("fonts", "NotoSans-Bold.ttf")
f = Figure(backgroundcolor = RGB(0.98, 0.98, 0.98),
resolution = (1000, 700), font = noto_sans)
ga = f[1, 1] = GridLayout()
gb = f[2, 1] = GridLayout()
gcd = f[1:2, 2] = GridLayout()
gc = gcd[1, 1] = GridLayout()
gd = gcd[2, 1] = GridLayout()
axtop = Axis(ga[1, 1])
axmain = Axis(ga[2, 1], xlabel = "Sepal Length", ylabel = "Sepal Width")
axright = Axis(ga[2, 2])
linkyaxes!(axmain, axright)
linkxaxes!(axmain, axtop)
iris = dataset("datasets", "iris")
labels = ["Setosa", "Versicolor", "Virginica"]
data = Array{Float64, 3}(undef, 50, 2, 3);
data[:, :, 1] = Matrix(iris[1:50, 1:2]);
data[:, :, 2] = Matrix(iris[51:100, 1:2]);
data[:, :, 3] = Matrix(iris[101:150, 1:2]);
for (label, col) in zip(labels, eachslice(data, dims = 3))
scatter!(axmain, col, label = label)
density!(axtop, col[:, 1])
density!(axright, col[:, 2], direction = :y)
end
ylims!(axtop, low = 0)
xlims!(axright, low = 0)
leg = Legend(ga[1, 2], axmain)
hidedecorations!(axtop, grid = false)
hidedecorations!(axright, grid = false)
leg.tellheight = true
colgap!(ga, 10)
rowgap!(ga, 10)
Label(ga[1, 1:2, Top()], "iris dataset", valign = :bottom,
padding = (0, 0, 5, 0))
f


※コメント投稿者のブログIDはブログ作成者のみに通知されます