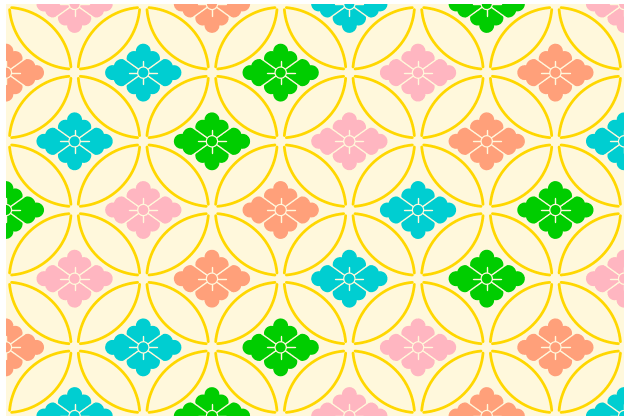
Julia で花菱をモチーフとした模様を描く(3)
include("plotter.jl")
function hanabisi3(nx=6, ny=6; r=1, fcol1=:darkturquoise,
fcol2=:green3, fcol3=:lightpink,
fcol4=:lightsalmon,
backcol=:cornsilk, circlecol=:gold,
width=600, height=400)
plotbegin(w=width, h=height)
nx += 1
ny += 3
x1, y1, x2, y2 = 2r, r, (2nx+1)r, ny*r
println("(width, height) = ($(x2 - x1), $(y2 - y1))")
plotbegin(w=width, h=height)
plotlimit(x1, y1, x2, y2)
plotbox(x1, y1, x2, y2, lwd=0, fcol=backcol)
r1, φ = 0.95r, 5
for i = 1:ny
y = i*r
for j = 1:nx
x = (2j + i % 2)r
plotcircle(x, y, r1, startangle=φ, endangle=90-φ, col=circlecol, lwd=2)
plotcircle(x, y, r1, startangle=90+φ, endangle=180-φ, col=circlecol, lwd=2)
plotcircle(x, y, r1, startangle=180+φ, endangle=270-φ, col=circlecol, lwd=2)
plotcircle(x, y, r1, startangle=270+φ, endangle=360-φ, col=circlecol, lwd=2)
fcol=[fcol1, fcol2, fcol3, fcol4][(3i + j) % 4 + 1]
hanabisi(x, y, r=0.5r, lwd=1, fcol=fcol,
backcol=backcol)
end
end
plotend()
end
hanabisi3(4, 4, width=630, height=420)