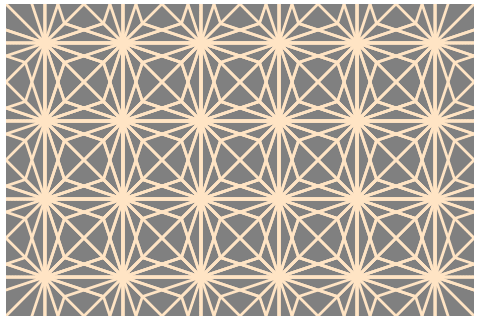
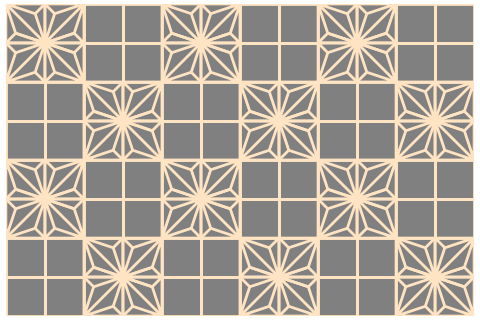
Julia で円をモチーフにした格子模様を描く(2)
plotter.jl を includehttps://blog.goo.ne.jp/r-de-r/e/bd71a52a09801335d56f7c47d879bfe3
include("plotter.jl")
function en2(nx=6, ny=5; r=1, lwd=2, width=600, height=400)
plotbegin(w=width, h=height)
nx += 3
ny += 2
x1, y1, x2, y2 = 1.5r*√3, r, (nx + 0.5)r * √3, (1.5ny + 0.5)r
println("(width, height) = ($(x2 - x1), $(y2 - y1))")
plotlimit(x1, y1, x2, y2)
plotbox(x1, y1, x2, y2, col=:gray, fcol=:gray)
for y = 1:ny
for x = 1:nx
plotcircle((x + (y % 2)/2)r*√3, y * 1.5r, r, lwd=lwd, col=:cornsilk)
end
end
plotend()
end
en2(5, 4, width=520, height=425)
savefig("en2.png")