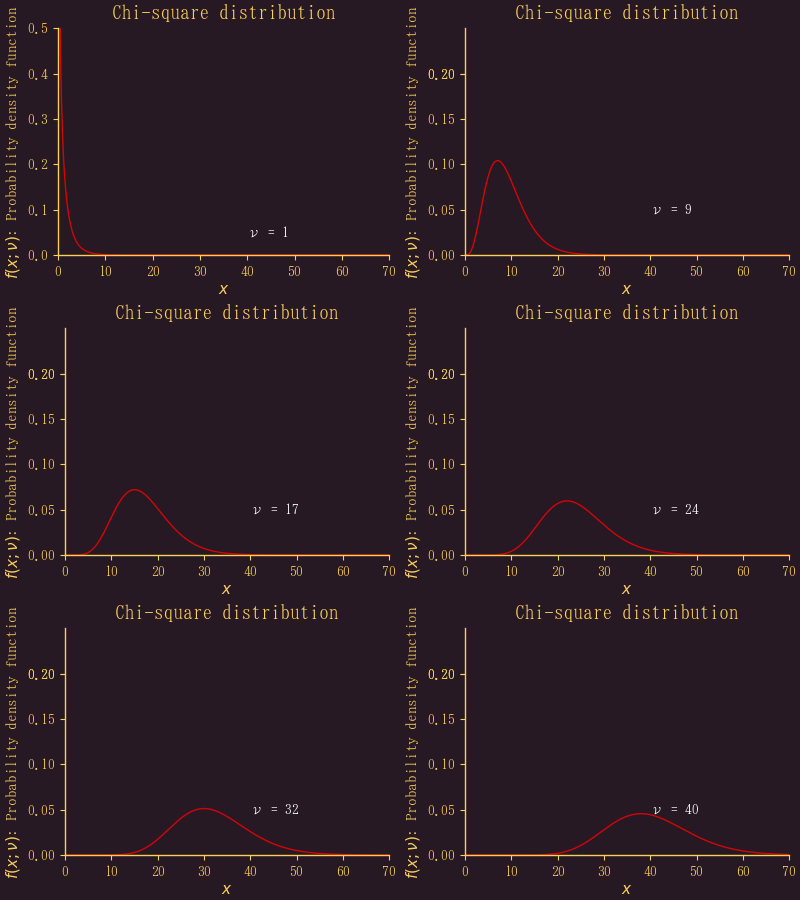
自由度が 1, 2 のときは形がちょっと違う。


作成するプログラムは以下の通り。
using Plots, PlotThemes, Rmath
function chisquaredistribution(;fps=2)
x = 0:0.1:100
theme(:orange)
pyplot(grid=false, label="", size=(400, 300))
anim = @animate for ν = 1:40
plt = plot(x, dchisq.(x, ν), color=:red, alpha=0.8,
tick_direction=:out, tickfontsize=10,
xlims=(0, 70), ylims=(0, ν <= 2 ? 0.5 : 0.25), xlabel="\$x\$",
ylabel="\$f(x;ν)\$: Probability density function",
title="Chi-square distribution")
plt1 = annotate!(40, 0.05, text("ν = $ν", :left, 10, :white))
end
gif(anim, "chisquaredistribution.gif", fps=fps)
end
chisquaredistribution()


※コメント投稿者のブログIDはブログ作成者のみに通知されます