


算額(その226)
中村信弥「改訂増補 長野県の算額」
http://www.wasan.jp/zoho/zoho.html
県内の算額3(208)須坂市塩川町公民館 永隆寺 推定・元治元年(1864)
鉤股弦の中に円弧及び正方形が入っている。股が 10寸のとき,鉤および正方形の一辺の長さを求めよ。
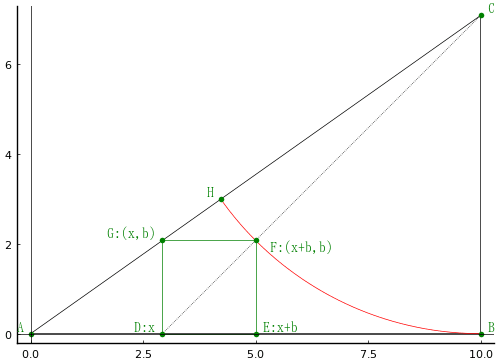
正方形の頂点 D, F を結ぶ直線は直角三角形の頂点 B を通る。
BC = a = CH = CF
DE = b = EF = FG = GD
AD = x = 10 - a
AG = c
GH = d
として,以下の連立方程式を解く。
using SymPy
@syms a::positive, b::positive, c::positive, d::positive, x::positive, s::positive
x = 10 - a
eq1 = b/x - a/10
eq1 = 10*b - a * x
eq2 = x^2 + b^2 - c^2
eq3 = (a + c + d)^2 - a^2 - 10^2
eq4 = (10 - x - b)^2 + (a - b)^2 - a^2;
res = solve([eq1, eq2, eq3, eq4], (a, b, c, d))
1-element Vector{NTuple{4, Sym}}:
((-110 - 40*sqrt(5 - 2*sqrt(6)) + 20*sqrt(30 - 12*sqrt(6)) + 45*sqrt(6))/(-8*sqrt(6) - 2*sqrt(6)*sqrt(5 - 2*sqrt(6)) + 5*sqrt(5 - 2*sqrt(6)) + 20), (-210 - 65*sqrt(5 - 2*sqrt(6)) + 30*sqrt(30 - 12*sqrt(6)) + 85*sqrt(6))/(-8*sqrt(6) - 2*sqrt(6)*sqrt(5 - 2*sqrt(6)) + 5*sqrt(5 - 2*sqrt(6)) + 20), (-120 - 15*sqrt(5 - 2*sqrt(6)) + 25*sqrt(30 - 12*sqrt(6)) + 45*sqrt(6))/(-2*sqrt(6) + 4*sqrt(5 - 2*sqrt(6)) + 5), 5*sqrt(5 - 2*sqrt(6)))
a: 鉤
den_a1 = denominator(res[1][1]) |> sympy.sqrtdenest |> simplify
分母の有理化
term =den_a1.args
temp1 = (term[1] + term[3]) - (term[2] + term[4])
den_a2 = den_a1 * temp1 |> expand
term = den_a2.args
temp2 = term[1] - term[2]
den_a3 = den_a2 * temp2 |> expand
分子の変換
num_a1 = numerator(res[1][1]) |> sympy.sqrtdenest |> simplify
num_a2 = num_a1 * temp1 * temp2 |> expand
解
num_a2 / den_a3 |> println
5*sqrt(2)
b: 正方形の一辺
分子の変換(分母は a の場合と同じ)
num_b1 = numerator(res[1][2]) |> sympy.sqrtdenest |> simplify
num_b2 = num_b1 * temp1 * temp2 |> expand
解
num_b2 / den_a3 |> println
-5 + 5*sqrt(2)
c: ⊿ADG の弦
den_c1 = denominator(res[1][3]) |> sympy.sqrtdenest |> simplify
分母の有理化
term = den_c1.args
temp1 = (term[1] + term[3]) - (term[2] + term[4])
den_c2 = den_c1 * temp1 |> expand
term = den_c2.args
temp2 = term[1] - term[2]
den_c3 = den_c2 * temp2 |> expand
分子の変換
num_c1 = numerator(res[1][3]) |> sympy.sqrtdenest |> simplify
num_c2 = num_c1 * temp1 * temp2 |> expand
解
num_c2 / den_c3 |> println
-5*sqrt(3) + 5*sqrt(6)
d: d = AC - a - c
res_d = res[1][4] |> sympy.sqrtdenest |> simplify
res_d |> println
-5*sqrt(2) + 5*sqrt(3)
a = 7.0710678, b = 2.0710678; c = 3.5871947; d = 1.5891862
鉤(a) は 7寸071あまりあり,正方形の一辺の長さ(b)は 2寸071あまりあり,ということである。
a, b, c, d の中に現れる 5 は,股=10 の1/2 である。
股を 3880899 などとすると,a, b はかなりきれいな数になる。
a = 2744210.0000001, b = 803760.5000001; c = 1392154.0231171; d = 616747.1235215

using Plots
using Printf
function circle(ox, oy, r, color=:red; beginangle=0, endangle=360, fill=false)
θ = beginangle:0.1:endangle
x = r.*cosd.(θ)
y = r.*sind.(θ)
if fill
plot!(ox .+ x, oy .+ y, linecolor=color, linewidth=0.5, seriestype=:shape, fillcolor=color)
else
plot!(ox .+ x, oy .+ y, color=color, linewidth=0.5)
end
end;
function point(x, y, string="", color=:green, position=:left, vertical=:top; mark=true)
mark && scatter!([x], [y], color=color, markerstrokewidth=0)
annotate!(x, y, text(string, 10, position, color, vertical))
end;
function segment(x1, y1, x2, y2, color=:black; linestyle=:solid, linewidth=0.5)
plot!([x1, x2], [y1, y2], color=color, linestyle=linestyle, linewidth=linewidth)
end;
function draw(ko, more)
pyplot(size=(500, 500), grid=false, aspectratio=1, label="", fontfamily="IPAMincho")
(a, b, c, d) = (ko/2) .* (sqrt(2), sqrt(2) - 1, sqrt(6) - sqrt(3), sqrt(3) - sqrt(2))
@printf("a = %.7f, b = %.7f; c = %.7f; d = %.7f\n", a, b, c, d)
x = ko - a
plot([0, ko, ko, 0], [0, 0, a, 0], color=:black, lw=0.5)
plot!([x, x + b, x + b, x, x], [0, 0, b, b, 0], color=:green, lw=0.5)
θ = round(atan(a/ko) / pi * 180, digits=0)
circle(ko, a, a, beginangle=180 + θ, endangle=270)
if more == true
segment(x, 0, ko, a, linestyle=:dot)
point(x, b, "G:(x,b) ", :green, :right, :bottom)
point(x + b, b, " F:(x+b,b)")
point(x * (1 + d/c), b * (1 + d/c), "H ", :green, :right, :bottom)
point(0, 0, "A ", :green, :right, :bottom)
point(ko - a, 0, "D:x ", :green, :right, :bottom)
point(ko - a + b, 0, " E:x+b", :green, :left, :bottom)
point(ko, 0, " B", :green, :left, :bottom)
point(ko, a, " C", :green, :left, :bottom)
hline!([0], color=:black, lw=0.5)
vline!([0], color=:black, lw=0.5)
else
plot!(showaxis=false)
end
end;


