


算額(その124)
群馬県安中市後閑 庚申塚の庚申塔
http://www.wasan.jp/gunma/kosinsol.html
長方形の中に 6 個の円が入っている。等円の直径が 1 寸のとき,長方形の長辺と短辺の長さを求めよ。
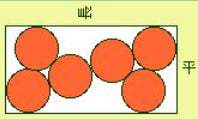
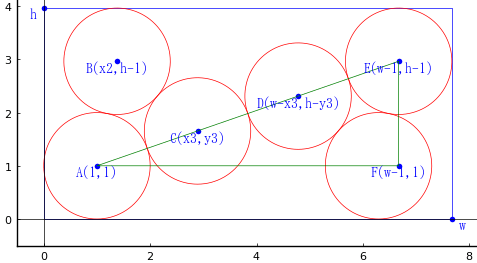
等円の半径を 1,長方形の長辺,短辺を w, h として図のように記号を定め,方程式を解く。
using SymPy
@syms h::positive, w::positive, x2::positive, x3::positive, y3::positive;
eq1 = (x2 - 1)^2 + (h - 2)^2 - 4 # A,B が外接
eq2 = (x3 - 1)^2 + (y3 - 1)^2 - 4 # A,C が外接
eq3 = (x3 - x2)^2 + (h - 1 - y3)^2 - 4 # B,C が外接
eq4 = (w - 2x3)^2 + (h - 2y3)^2 - 4 # C,D が外接
eq5 = (w - 2)^2 + (h - 2)^2 - 6^2; # 緑の直角三角形 AEF でピタゴラスの定理
res = solve([eq1, eq2, eq3, eq4, eq5], (w, h, x2, x3, y3))
2-element Vector{NTuple{5, Sym}}:
(2 + 15*sqrt(7)/7, 2 - 3*sqrt(21)/7, sqrt(7)/7 + 1, 1 + 5*sqrt(7)/7, 1 - sqrt(21)/7)
(2 + 15*sqrt(7)/7, 3*sqrt(21)/7 + 2, sqrt(7)/7 + 1, 1 + 5*sqrt(7)/7, sqrt(21)/7 + 1)
2 番目の解が適切。
for i = 1:2
if res[i][2].evalf() > res[i][3].evalf()
println("i = $i")
println("w = $(res[i][1].evalf())")
println("h = $(res[i][2].evalf())")
println("x2 = $(res[i][3].evalf())")
println("x3 = $(res[i][4].evalf())")
println("y3 = $(res[i][5].evalf())\n")
end
end
i = 2
w = 7.66946709513841
h = 3.96396101212393
x2 = 1.37796447300923
x3 = 2.88982236504614
y3 = 1.65465367070798
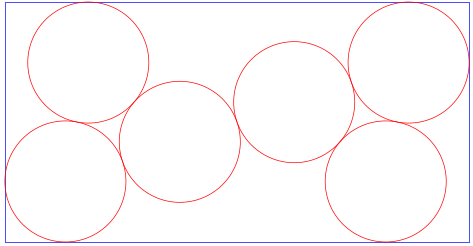
もとの単位に戻すにはそれぞれの数値を半分にする。長辺は 3寸8分3厘5毛,短編は 1寸9分8厘2毛である。
(w, h) = (2 + 15*sqrt(7)/7, 3*sqrt(21)/7 + 2) ./ 2
(3.834733547569204, 1.9819805060619657)
using Plots
using Printf
function circle(ox, oy, r, color=:red; beginangle=0, endangle=360)
θ = beginangle:0.1:endangle
x = r.*cosd.(θ)
y = r.*sind.(θ)
plot!(ox .+ x, oy .+ y, color=color, linewidth=0.5)
end;
function circle(ox, oy, r, color=:red; beginangle=0, endangle=360, fill=false)
θ = beginangle:0.1:endangle
x = r.*cosd.(θ)
y = r.*sind.(θ)
if fill
plot!(ox .+ x, oy .+ y, color=color, linewidth=0.5, seriestype=:shape, fillcolor=color)
else
plot!(ox .+ x, oy .+ y, color=color, linewidth=0.5)
end
end;
function point(x, y, string="", color=:green, position=:left, vertical=:top; mark=true)
mark && scatter!([x], [y], color=color, markerstrokewidth=0)
annotate!(x, y, text(string, 10, position, color, vertical))
end;
function segment(x1, y1, x2, y2, color=:black; linestyle=:solid, linewidth=0.5)
plot!([x1, x2], [y1, y2], color=color, linestyle=linestyle, linewidth=linewidth)
end;
function draw(more)
pyplot(size=(500, 500), grid=false, aspectratio=1, label="", fontfamily="IPAMincho")
(w, h, x2, x3, y3) = [z.evalf() for z in res[2]]
@printf("w = %.3f, h = %.3f, x2 = %.3f, x3 = %.3f, y3 = %.3f\n", w, h, x2, x3, y3)
@printf("w = %.3f 寸, h = %.3f 寸", w/2, h/2)
plot([0, w, w, 0, 0], [0, 0, h, h, 0], color=:blue, lw=0.5)
circle(1, 1, 1)
circle(x2, h-1, 1)
circle(x3, y3, 1)
circle(w-x3, h-y3, 1)
circle(w-1, h - 1, 1)
circle(w-x2, 1, 1)
if more == true
point(0, h, "h ", :blue, :right)
point(w, 0, " w", :blue)
point(1, 1, "A(1,1)", :blue, :center)
point(x2, h-1, "B(x2,h-1)", :blue, :center)
point(x3, y3, "C(x3,y3)", :blue, :center)
point(w-x3, h-y3, "D(w-x3,h-y3)", :blue, :center)
point(w-1, h-1, "E(w-1,h-1)", :blue, :center)
point(w-1, 1, "F(w-1,1)", :blue, :center)
plot!([1, w - 1, w - 1, 1,], [1, 1, h - 1, 1], color=:green, lw=0.5)
hline!([0], color=:black, lw=0.5)
vline!([0], color=:black, lw=0.5)
plot!(xlims=(-0.5, 8.5), ylims=(-0.5, 4.5))
else
plot!(showaxis=false)
end
end;
w = 7.669, h = 3.964, x2 = 1.378, x3 = 2.890, y3 = 1.655
w = 3.835 寸, h = 1.982 寸


