


楕円の接線
原点を中心とする長径 a,短径 b の楕円がある。y 軸上に中心を持つ円がこの楕円に外接し,さらに円の中心を通る楕円の接線の傾きが slope であるとき,円の半径はいかほどか。

using SymPy
@syms a, b, x1, y1, r, tanθ
eq1 = x1^2/a^2 + y1^2/b^2 - 1
eq2 = -b^2*x1 / (a^2*y1) + (r + b - y1)/x1 #
eq3 = (r + b - y1)/x1 + tanθ;
res = solve([eq1, eq2, eq3], (x1, y1, r))
2-element Vector{Tuple{Sym, Sym, Sym}}:
(-a^2*tanθ/sqrt(a^2*tanθ^2 + b^2), b^2/sqrt(a^2*tanθ^2 + b^2), -b + sqrt(a^2*tanθ^2 + b^2))
(a^2*tanθ/sqrt(a^2*tanθ^2 + b^2), -b^2/sqrt(a^2*tanθ^2 + b^2), -b - sqrt(a^2*tanθ^2 + b^2))
res[1][3] |> println
-b + sqrt(a^2*tanθ^2 + b^2)
以上の結果に基づき,以下の関数を定義する。
引数
楕円の長径 a,短径 b,接線の傾き(符号に注意)
戻り値
接点の座標 (x, y),楕円に外接する円の半径 r
func(a, b, tanθ) = (-a^2*tanθ/sqrt(a^2*tanθ^2 + b^2), b^2/sqrt(a^2*tanθ^2 + b^2), -b + sqrt(a^2*tanθ^2 + b^2));
使用例
function circle(ox, oy, r, color=:red; beginangle=0, endangle=360, fill=false)
θ = beginangle:0.1:endangle
x = r.*cosd.(θ)
y = r.*sind.(θ)
if fill
plot!(ox .+ x, oy .+ y, linecolor=color, linewidth=0.5, seriestype=:shape, fillcolor=color)
else
plot!(ox .+ x, oy .+ y, color=color, linewidth=0.25)
end
end;
function point(x, y, string="", color=:green, position=:left, vertical=:top; mark=true)
mark && scatter!([x], [y], color=color, markerstrokewidth=0)
annotate!(x, y, text(string, 10, position, color, vertical))
end;
function segment(x1, y1, x2, y2, color=:black; linestyle=:solid, linewidth=0.5)
plot!([x1, x2], [y1, y2], color=color, linestyle=linestyle, linewidth=linewidth)
end;
function ellipse(ox, oy, ra, rb; φ=0, beginangle=0, endangle=360,
color=:black, lty=:solid, lwd=0.5, fcolor="")
"""
(ox, oy) を中心,ra, rb を半径とする楕円(楕円弧)。
fcolor を指定すると塗りつぶし。
"""
θ = beginangle:0.1:endangle
if φ == 0
if fcolor == ""
plot!(ra .* cosd.(θ) .+ ox, rb .* sind.(θ) .+ oy,
linecolor=color, linestyle=lty, linewidth=lwd)
else
plot!(ra .* cosd.(θ) .+ ox, rb .* sind.(θ) .+ oy,
linecolor=color, linestyle=lty, linewidth=lwd,
seriestype=:shape, fillcolor=fcolor)
end
else
x = ra .* cosd.(θ)
y = rb .* sind.(θ)
cosine = cosd(φ)
sine = sind(φ)
if fcolor == ""
plot!(cosine .* x .- sine .* y .+ ox,
sine .* x .+ cosine .* y .+ oy,
linecolor=color, linestyle=lty, linewidth=lwd)
else
plot!(cosine .* x .- sine .* y .+ ox,
sine .* x .+ cosine .* y .+ oy,
linecolor=color, linestyle=lty, linewidth=lwd,
seriestype=:shape, fillcolor=fcolor)
end
end
end;
using Plots
using Printf
function draw(a, b, c, more)
pyplot(size=(500, 500), grid=false, aspectratio=1, label="", fontfamily="IPAMincho")
(x1, y1, r1) = func(a, b, c)
println("x1 = $x1, y1 = $y1, r1 = $r1")
println("slope = $(-(r1 + b - y1)/x1)")
plot()
circle(0, r1+b, r1)
ellipse(0, 0, a, b)
segment(0, r1+b, x1, y1)
if more == true
point(x1, y1, " (x1,y1)", :green, :left, :bottom)
point(0, b, " b")
point(a, 0, " a", :green, :left, :top)
point(0, r1+b, " r1+b")
hline!([0], color=:black, lw=0.5)
vline!([0], color=:black, lw=0.5)
else
plot!(showaxis=false)
end
end;
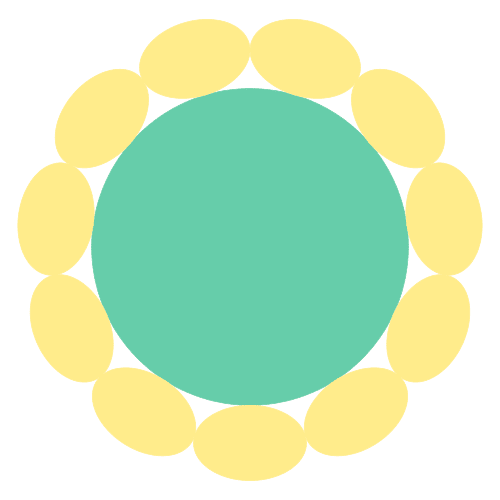
function draw3(a, b, num=6)
pyplot(size=(500, 500), grid=false, aspectratio=1, label="", fontfamily="IPAMincho")
(x, y, r) = func(a, b, -cot(pi/num))
plot()
circle(0, 0, r, :aquamarine3, fill=true)
deg = 360/num
for i = 1:num
deg2 = i*deg
ellipse((r + b)cosd(deg2 - 90), (r + b)sind(deg2 - 90), a, b, φ = deg2, color=:lightgoldenrod1, fcolor=:lightgoldenrod1)
end
plot!(showaxis=false)
end;
draw3(3, 2, 11)


※コメント投稿者のブログIDはブログ作成者のみに通知されます