


算額(その213)
中村信弥「改訂増補 長野県の算額」
http://www.wasan.jp/zoho/zoho.html
県内の算額2(127)
長野県伊那市羽広 仲仙寺 天保2年(1831)
外円の中に斜線 4 本,等円,甲円,乙円を4個ずつ入れる。外円の径が分かっているときに乙円の径を求めよ。
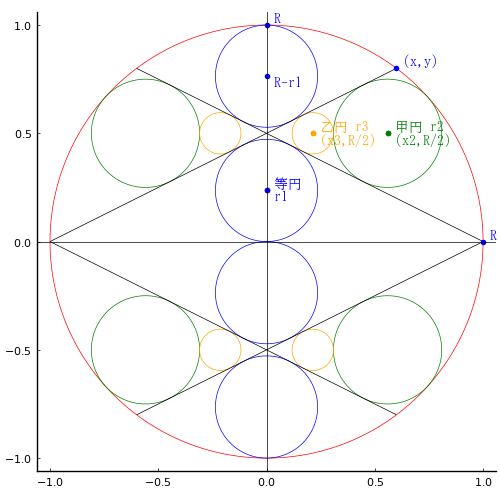
外円,等円,甲円,乙円の半径を R, r1, r2, r3 と置く。甲円,乙円の中心座標を (x2, R/2), (x3, R/2) と置く。第1象限にある斜線と円の交点を (x, y) と置く。
以下の連立方程式を解く。
using SymPy
function distance(x1, y1, x2, y2, x0, y0)
p1, p2 = sympy.Point(x1, y1), sympy.Point(x2, y2)
l = sympy.Line(p1, p2)
l.distance(sympy.Point(x0, y0))^2 # 二乗距離を返す!!
end;
@syms r1::positive, r2::positive, r3::positive, x2::positive, x3::positive, x::positive, y::positive, R::positive;
eq1 = x2^2 + R^2//4 - (R - r2)^2
eq2 = distance(0, R/2, R, 0, 0, R - r1) - r1^2
eq3 = distance(0, R/2, R, 0, x2, R/2) - r2^2
eq4 = distance(0, R/2, R, 0, x3, R/2) - r3^2
eq5 = x2 - r2 - r3 - x3
eq11 = x^2 + y^2 - R^2
eq12 = 2y - R - x
res = solve([eq1, eq2, eq3, eq4, eq5, eq11, eq12], (r1, r2, r3, x2, x3, x, y))
1-element Vector{NTuple{7, Sym}}:
(R*(-2 + sqrt(5)), R/4, R*(3 - sqrt(5))/8, sqrt(5)*R/4, R*(-5/8 + 3*sqrt(5)/8), 3*R/5, 4*R/5)
外円の径を R としたとき,乙円の径は R*(3 - sqrt(5))/8 である。
術では,「3 から 5 の平方根を引き 8 で割って外円径を掛ける」といっている。
R が 1 のとき,(3 - √5)/8 = 0.09549150281252627 である。
R = 1.00000; r1 = 0.23607; r2 = 0.25000; r3 = 0.09549; x2 = 0.55902; x3 = 0.21353; x = 0.60000; y = 0.80000

using Plots
using Printf
function circle(ox, oy, r, color=:red; beginangle=0, endangle=360)
θ = beginangle:0.1:endangle
x = r.*cosd.(θ)
y = r.*sind.(θ)
plot!(ox .+ x, oy .+ y, color=color, linewidth=0.5)
end;
function circle4(x, y, r, color=:red)
circle(x, y, r, color)
circle(x, -y, r, color)
circle(-x, y, r, color)
circle(-x, -y, r, color)
end;
function point(x, y, string="", color=:blue, position=:left, vertical=:top; mark=true)
mark && scatter!([x], [y], color=color, markerstrokewidth=0)
annotate!(x, y, text(string, 10, position, color, vertical))
end;
function segment(x1, y1, x2, y2, color=:black; linestyle=:solid, linewidth=0.5)
plot!([x1, x2], [y1, y2], color=color, linestyle=linestyle, linewidth=linewidth)
end;
function draw(R, more)
pyplot(size=(500, 500), grid=false, aspectratio=1, label="", fontfamily="IPAMincho")
(r1, r2, r3, x2, x3, x, y) = (R*(-2 + sqrt(5)), R/4, R*(3 - sqrt(5))/8, sqrt(5)*R/4, R*(-5/8 + 3*sqrt(5)/8), 3*R/5, 4*R/5)
@printf("R = %.5f; r1 = %.5f; r2 = %.5f; r3 = %.5f; x2 = %.5f; x3 = %.5f; x = %.5f; y = %.5f\n", R, r1, r2, r3, x2, x3, x, y)
plot()
circle(0, 0, R, :red)
circle(0, r1, r1, :blue)
circle(0, R - r1, r1, :blue)
circle(0, -r1, r1, :blue)
circle(0, -R + r1, r1, :blue)
circle4(x2, R/2, r2, :green)
circle4(x3, R/2, r3, :orange)
segment(-R, 0, x, y)
segment(R, 0, -x, y)
segment(-R, 0, x, -y)
segment(R, 0, -x, -y)
if more == true
point(0, r1, " r1")
point(0, r1, " 等円", :blue, :left, :bottom)
point(0, R - r1, " R-r1")
point(0, R, " R", :blue, :left, :bottom)
point(R, 0, " R", :blue, :left, :bottom)
point(x2, R/2, " (x2,R/2)", :green)
point(x2, R/2, " 甲円 r2", :green, :left, :bottom)
point(x3, R/2, " (x3,R/2)", :orange)
point(x3, R/2, " 乙円 r3", :orange, :left, :bottom)
point(x, y, " (x,y)", :blue, :left, :bottom)
hline!([0], color=:black, lw=0.5)
vline!([0], color=:black, lw=0.5)
else
plot!(showaxis=false)
end
end;


