算額(その251)
中村信弥「改訂増補 長野県の算額」
http://www.wasan.jp/zoho/zoho.html
県内の算額3(234)
長野県北佐久郡軽井沢町峠 熊野神社 明治5年(1872)
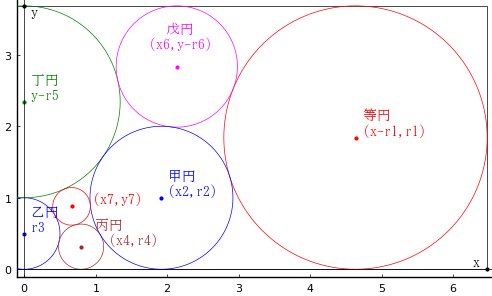
長方形の中に 12 個の円が入っている。乙円の径が 1 寸のとき,甲円の径を求めよ。


(-x,0), (x, y) を対角とする長方形の右半分を対象にする。
等円の半径,中心座標を r1, (x - r1, r) とする。y = 2r1 である。
甲円の半径,中心座標を r2, (x2, r2) とする。
乙円の半径,中心座標を r3, (0, r3) とする。
丙円の半径,中心座標を r4, (x4, r4) とする。
丁円の半径,中心座標を r5, (0, y - r5) とする。
戊円の半径,中心座標を r6, (x6, y - r6) とする。
無名円の半径,中心座標を r7, (x7, y7) とする。
以下の連立方程式を解く。
include("julia-source.txt");
r3 は変数のままで,nlsolve() を使うときに定義する。
using Printf
using NLsolve
function nls(func, params...; ini = [0.0])
if typeof(ini) <: Number
r = nlsolve((vout, vin) -> vout[1] = func(vin[1], params..., [ini]), ftol=1e-14)
v = r.zero[1]
else
r = nlsolve((vout, vin)->vout .= func(vin, params...), ini, ftol=1e-14)
v = r.zero
end
return v, r.f_converged
end;
function H(u)
(r1, x, r2, x2, r4, x4, r5, r6, x6, r7, x7, y7) = u
return [
(r1 - r2)^2 - (r1 + r2)^2 + (-r1 + x - x2)^2, # eq1
(-r1 + r6)^2 - (r1 + r6)^2 + (-r1 + x - x6)^2, # eq2
-(r2 + r6)^2 + (x2 - x6)^2 + (-2*r1 + r2 + r6)^2, # eq3
(r2 - r4)^2 - (r2 + r4)^2 + (x2 - x4)^2, # eq4
x4^2 + (r3 - r4)^2 - (r3 + r4)^2, # eq5
x7^2 - (r3 + r7)^2 + (r3 - y7)^2, # eq6
-(r2 + r7)^2 + (r2 - y7)^2 + (x2 - x7)^2, # eq7
x6^2 + (r5 - r6)^2 - (r5 + r6)^2, # eq8
x2^2 - (r2 + r5)^2 + (2*r1 - r2 - r5)^2, # eq9
x7^2 - (r5 + r7)^2 + (2*r1 - r5 - y7)^2, # eq10
-(r4 + r7)^2 + (r4 - y7)^2 + (x4 - x7)^2, # eq11
-r1 + r3 + r5, # eq12
]
end;
r3 = 0.5
iniv = [big"1.5", 5.45, 0.9, 1.6, 0.22, 0.69, 1, 0.7, 1.8, 0.18, 0.5, 0.9]
res = nls(H, ini=iniv);
names = ["r1", "x", "r2", "x2", "r4", "x4", "r5", "r6", "x6", "r7", "x7", "y7"]
for i in 1:length(names)
@printf("%2s = %.7f\n", names[i], res[1][i])
end
println("収束した? ",res[2])
r1 = 1.8419829
x = 6.4757422
r2 = 1.0000000
x2 = 1.9193660
r4 = 0.3160343
x4 = 0.7950274
r5 = 1.3419829
r6 = 0.8482252
x6 = 2.1338263
r7 = 0.2631404
x7 = 0.6619656
y7 = 0.8797167
収束した? true
甲円の半径は r2 = 1 よって,もとの単位では甲円の直径は 2 寸である。
using Plots
function circlesym(x, y, r, c)
circle(x, y, r, c)
circle(-x, y, r, c)
end;
function draw(more)
pyplot(size=(500, 500), grid=false, aspectratio=1, label="", fontfamily="IPAMincho")
(r1, x, r2, x2, r4, x4, r5, r6, x6, r7, x7, y7) = res[1]
y = 2r1
plot([-x, x, x, -x, -x], [0, 0, y, y, 0], color=:black, lw=0.5)
circlesym(x - r1, r1, r1, :red)
circle(0, r3, r3, :blue)
circle(0, 2r3 + r5, r5, :green)
circlesym(x4, r4, r4, :brown)
circlesym(x6, y - r6, r6, :magenta)
circlesym(x2, r2, r2, :blue)
circlesym(x7, y7, r7, :red)
if more == true
point(x - r1, r1, " 等円\n (x-r1,r1)", :red, :left, :bottom)
point(x2, r2, " 甲円\n (x2,r2)", :blue, :left, :bottom)
point(x6, y - r6, " 戊円\n (x6,y-r6)\n", :magenta, :center, :bottom)
point(0, y - r5, " 丁円\n y-r5", :green, :left, :bottom)
point(0, r3, " 乙円\n r3", :blue, :left, :bottom)
point(x4, r4, " 丙円\n (x4,r4)", :brown, :left, :bottom)
point(x7, y7, " (x7,y7)", :red, :left, :bottom)
point(x, 0, "x ", :black, :right, :bottom)
point(0, y, " y", :black, :left, :top)
hline!([0], color=:black, lw=0.5)
vline!([0], color=:black, lw=0.5, xlims=(-0.1,6.6))
else
plot!(showaxis=false)
end
end;


※コメント投稿者のブログIDはブログ作成者のみに通知されます