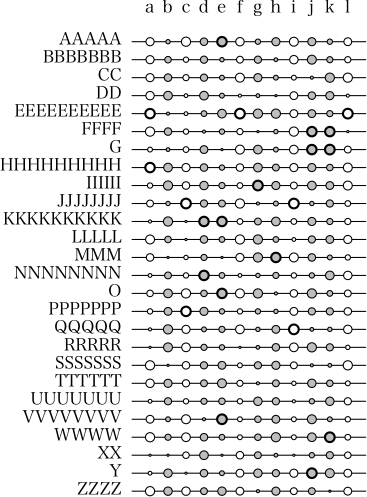
このグラフの呼び名 †
K? (2011-04-01 (金) 03:58:55)
こちらの論文(PDF) の図4のようなグラフはなんと呼ぶのでしょうか? また、このグラフをRで作成するパッケージはありますでしょうか?
名前だけでも分かれば検索できるようになると思うので、どうぞよろしくお願いします。
聞く場所(相手)が違う。その文書を書いた人に聞けばすぐにわかることであろう。
それに,こんなところで聞いて回答を待っている間に,プログラムを書けばよい。
func <- function(x, factor=1, threshold=NA, color="gray")
{
nr <- nrow(x)
nc <- ncol(x)
if (is.na(threshold)) threshold <- mean(x)+sd(x)
threshold <- factor*sqrt(threshold)
x <- factor*sqrt(x[nr:1,])
theta <- seq(0, 2*pi, length=100)
cos.x <- cos(theta)
sin.y <- sin(theta)
plot(c(0, nc+1), c(0, nr+1), type="n", axes=FALSE, xlab="", ylab="", asp=1)
for (i in 1:nr) {
segments(0, i, nc+1, i)
for (j in 1:nc) {
polygon(j+x[i, j]*cos.x, i+x[i, j]*sin.y, col=color[j], lwd=(x[i, j] > threshold)+1)
}
}
text(0, 1:nr, labels=rownames(x), pos=2, xpd=TRUE)
text(1:nc, nr+1, labels=colnames(x), pos=3, xpd=TRUE)
}
# test data
nc <- 12
nr <- 26
set.seed(123456789)
x <- matrix(sample(20, nr*nc, replace=TRUE), nr, nc)
color <- c("white", "gray", "white", "gray", "gray", "white", "gray", "gray", "white", "gray", "gray", "white")
colnames(x) <- letters[1:nc]
rownames(x) <- sapply(1:nr, function(i) paste(rep(LETTERS[i], sample(1:10, 1)), collapse=""))
# factor:円の大きさの縮小率,threshold:その値より大きければ太線で描く,color:色
func(x, factor=0.06, threshold=18, color=color)


