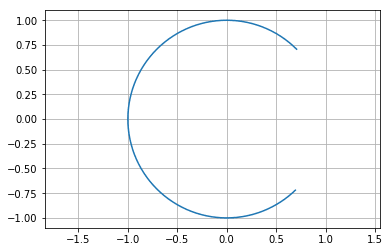
PythonでCを描いてみた。
import matplotlib.pyplot as plt
import numpy as np
th=np.arange(45,315)
x=np.cos(np.radians(th))
y=np.sin(np.radians(th))
plt.plot(x,y)
plt.axis('equal')
plt.grid()
plt.show()
import numpy as np
th=np.arange(45,315)
x=np.cos(np.radians(th))
y=np.sin(np.radians(th))
plt.plot(x,y)
plt.axis('equal')
plt.grid()
plt.show()