・ 科学雑誌編集者・出版社への申立て
申立てPart.1, 申立てPart.2, 申立てPart.3, 申立てPart.4
・ 申立てに対する、科学雑誌編集者・出版社からの返信メール
返信Part.1、返信Part.2、返信Part.3
Cardiovasc Res誌への申立て
------------------------------------------------------------
Comments sent via CARDIOVASC RES Feedback Page
COMMENTS:
Dear Dr. Hans Michael Piper,
Please investigate fraudulent data of the article “Cilostazol inhibits cytokine-induced nuclear factor-kappaB activation via AMP-activated protein kinase activation in vascular endothelial cells.” Hattori Y, Suzuki K, Tomizawa A, Hirama N, Okayasu T, Hattori S, Satoh H, Akimoto K, Kasai K., published in Cardiovasc Research (2009,81,133-9). You can find fabricated (falsified) Fig. 1(A),(B),(C),(D) and Fig.4(A),(B),(C) : namely,
(1)
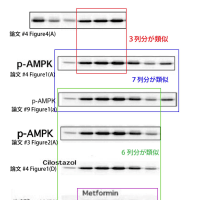
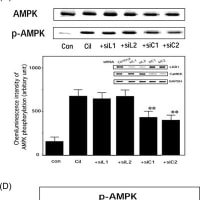
The first, second and third bands from right of IkB-alpha image, top-panel in Fig. 4(A) of Ref.3 is similar to the second, third and fourth bands from left of pAMPK image in Fig. 1(A) of Ref.3.
Moreover, the first and second bands from left of IkB-alpha image, top-panel in Fig. 4(A) of Ref.3 is similar to both the fifth and sixth bands from left of pAMPK image in Fig. 1(A) of Ref.3
and the fifth and sixth bands from left of pAMPK image in Fig. 1(a) of Ref.7.
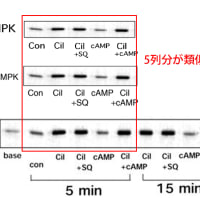
Furthermore, the pAMPK image (all 7 bands) in Fig. 1(A) of Ref.3 is similar to the pAMPK image (all 7 bands) in Fig. 1(a) of Ref.7
,and first to sixth bands from left of the above pAMPK image of Ref.3,9 are similar to the pAMPK image for cilostazol in Fig. 1(D) of Ref.3
and the pAMPK image in Fig. 2(A) of Ref.2
and the pAMPK image for Metformin in Fig. 3(b) of Ref.4.
In addition, the rightside 5 bands (2.5 min – 60 min) of the pAMPK imgae in Fig. 2(A) of Ref.2 are similar to upside-down and left-right reversal of the pAMPK image in Fig. 3(A) of Ref.2.
(2)
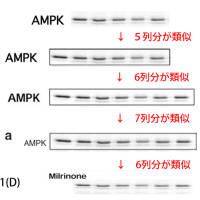
The AMPK image in Fig. 1(A) of Ref.3 is similar to the APMK image in Fig. 1(a) of Ref.7.
Moreover, the leftside 6 bands of these two APMK image are similar to the AMPK image in Fig. 2(A) of Ref.2.
Furthermore, rightside 5 bands of this AMPK image in Fig. 2(A) of Ref.2 are similar to the pAMPK image for Milrinone in Fig. 1(D) of Ref.3
(3)
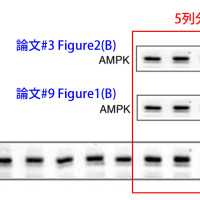
The rightside 5 bands of the AMPK image in Fig. 1(B) of Ref.3 is similar to both the AMPK image in Fig. 2(B) of Ref.2 and the AMPK image in Fig. 1(b) of Ref.7.
Likewise, 5 bands (second to sixth bands from left) of pAMPK image in Fig. 1(B) of Ref.3 are similar to the pAMPK image in Fig. 2(B) of Ref.2 and the pAMPK image in Fig. 1(b) of Ref.7.
(4)
The ACC and pACC images in Fig. 1(A) of Ref.3 are similar to the ACC and pACC images in Fig. 1(a) of Ref.7, respectively.
Moreover, the leftside 6 bands of these two images are similar to the ACC and p-ACC images in Fig. 2(A) of Ref.2.
(5)
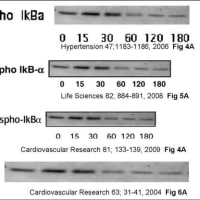
The Phospho-IkB-alpha image in Fig. 4(A) of Ref.3 is similar to
the Phospho-IkB-alpha image in Fig. 5(A) of Ref.6
and the Phospho-IkBa image in Fig. 3(A) of Ref.8
and the Phospho IkB-alpha image in Fig. 6(A) of Ref.9.
(6)
The IkB-alpha image in Fig. 4(B) of Ref.3 is similar to
the IKB-alpha image in Fig. 5(B) of Ref.6
and the IkBa image in Fig. 3(B) of Ref.8
and the leftside 4 bands of the ONOO-IkB-alpha image in Fig. 6(A) of Ref.9.
(7) The GST-Ikb-alpha image of top panel in Fig.4(C) of Ref.1 is similar to both GST-Ikb-alpha image of top panel in Fig.4(C) of Ref.3 and IkB-alpha image of top panel in Fig.5(C) of Ref.6
(8) The IKKalpha/beta image in Fig. 4(C) of Ref.3 is similar to both the ACC image in Fig. 1(A) of Ref.6 and the IKKalpha/beta image in Fig. 5(C) of Ref.6.
(9) The GST-Ikb-alpha image of bottom panel in Fig.4(C) of Ref.3 is similar to GST-Ikb-alpha image of bottom panel in Fig.4(C) of Ref.6. Moreover, these two images are similar to both the left-right reversal of the Akt image in Fig. 1(A) of Ref.1 and the upside-down + left-right reversal of the GST-Ikb-alpha image of bottom panel in Fig.4(C) of Ref.1
(10)
The GST-IkB-alpha image, bottom panel in Fig. 4(C) of Ref.3 is similar to the Akt image in Fig. 1(A) of Ref.6.
(11)
The left-side 4 bands (first to fourth bands from left) of the AMPK image in Fig. 1(C) of Ref.3 is similar to the left-side 4 bands (first to fourth bands from left) of the AMPK image in Fig. 2(A) of Ref.5.
(12)
The left-side 3 bands (first to third bands from left) of pAMPK image in Fig. 1(C) of Ref.3 is similar to the left-side 3 bands (firtst to third bands from left) of pAPMK image in Fig. 2(A) of Ref.5
__________________
References
1,
Metabolism. 2010 Jun 25. [Epub ahead of print]
2,
J Atheroscler Thromb. 2010;17(5):503-9.
3,
Cardiovasc Res. 2009 Jan 1;81(1):133-9.
4,
Hypertens Res. 2009 Sep;32(9):765-9.
5,
FEBS Lett. 2008 May 28;582(12):1719-24.
6,
Life Sci. 2008 Apr 9;82(15-16):884-91.
7,
Am J Hypertens. 2008 Apr;21(4):451-7.
8,
Hypertension. 2006 Jun;47(6):1183-8.
9,
Cardiovasc Res. 2004 Jul 1;63(1):31-40.
J Hypertension誌への申立て
件名
Allegations of fabrication and falsification [J Hypertens. 2005 Jul;23(7):1375-82]
宛先
Phil.Daly@wolterskluwer.com ; Magda.Lewandowska@wolterskluwer.com ; j.hypertension@centroipertensione.191.it ; alberto.zanchett
Please investigate fraudulent data of the article [Supplementation with tetrahydrobiopterin prevents the cardiovascular effects of angiotensin II-induced oxidative and nitrosative stress.
] by Kase H, Hashikabe Y, Uchida K, Nakanishi N, Hattori Y. published in J Hypertens. [2005 Jul;23(7):1375-82.]. You can find the fabricated (falsified) Fig. 5(a) : namely, eNOS Western blot image in Fig. 5(a) of the above article [J Hypertens. 2005 Jul;23(7):1375-82.] is identical to eNOS Western blot image in Fig. 4 of another article [Eur J Pharmacol. 2007 Jan 19;555(1):48-53.] and MCP-1 Wstern blot image (left-right reversal) in Fig. 4(B) of another article [Hypertension. 2006 Jun;47(6):1183-8.] .
Moreover, iNOS Protein Western blot images in Fig. 5 of the above article [J Hypertens. 2005 Jul;23(7):1375-82.] is identical to iNOS Western blot image in Fig. 4 of another article [Eur J Pharmacol. 2007 Jan 19;555(1):48-53.] and MCP-1 Western blot image in Fig. 3(C) of another article [Life Sci. 2007 Aug 23;81(11):939-43.].
References
1
J Hypertens. 2005 Jul;23(7):1375-82.
2
Hypertension. 2006 Jun;47(6):1183-8.
3
Eur J Pharmacol. 2007 Jan 19;555(1):48-53.
4
Life Sci. 2007 Aug 23;81(11):939-43.
Metabolism誌への申立て
件名
Allegations of fabrication and falsification [Metabolism. 2010 Jun 25. [Epub ahead of print]
宛先
metabolism@elsevier.com
CC
andrew.miller@elsevier.com
Dear Dr.Mantzoros,
Please investigate fraudulent data of the article “Fenofibrate suppresses microvascular inflammation and apoptosis through adenosine monophosphate-activated protein kinase activation.” by Tomizawa A, Hattori Y, Inoue T, Hattori S, Kasai K., published in
Metabolism Clinical and Experimental (2010 Jun 25. [Epub ahead of print]). You can find fabricated (falsified) Fig. 1(A) and 4(A),(B),(C) : namely,
(1) The GST-Ikb-alpha image of top panel in Fig.4(C) of the above article (Ref.1) is quite similar to both GST-Ikb-alpha image of top panel in Fig.4(C) of another article (Ref.2) and Ikb-alpha image of top panel in Fig.5(C) of another article (Ref.4)
(2) The GST-Ikb-alpha image of bottom panel in Fig.4(C) of Ref.2 is quite similar to GST-Ikb-alpha image of bottom panel in Fig.4(C) of Ref.4. Moreover, these two images are quite similar to both the left-right reversal of the Akt image in Fig. 1(A) of Ref.1 and the upside-down + left-right reversal of the GST-Ikb-alpha image of bottom panel in Fig.4(C) of Ref.1
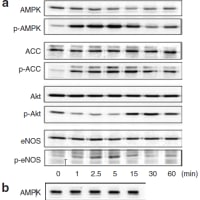
(3) The AMPK image and pAMPK image in Fig.1(A) of Ref.1 are similar to the AMPK image and pAMPK image in Fig.1(A) of Ref.4, respectively.
(4) The p-Akt image in Fig.1(A) of Ref.1 is similar to the p-Akt image in Fig.1(A) of Ref.4.
(5) The eNOS image in Fig.1(A) of Ref.1 is similar to the left-right reversal of eNOS image in Fig.1(A) of Ref.4.
(6) The leftmost band (for 0 min) of IkB-alpha image, top-panel in Fig.4(A) of Ref.1 is similar to leftmost band of GST-IkB-alpha image, bottom-panel in Fig.4(C) of Ref.1.
(7) The second, third and forth bands from left (15,30,60 min) of IkB-alpha image, top-panel in Fig.4(A) of Ref.1 is similar to the second, third and forth bands from left (for 0, 30, 100 uM fenofibrate) of IkB-alpha image in Fig.4(B) of Ref.1. Moreover, these two images are similar to the first, second and third bands from left (for 0, 5, 15 min) of p-Akt image, top-panel in Fig.2(B) of Ref.3
(8) The leftmost band (for Cont) of IkB-alpha image in Fig.4(A) of Ref.1 is similar to the forth band (for 30 min) from left of pAkt image, top-panel in Fig.2(B) of Ref.3
References
1,
Metabolism. 2010 Jun 25. [Epub ahead of print]
2,
Cardiovasc Res. 2009 Jan 1;81(1):133-9.
3
Diabetes Obes Metab. 2009 Feb;11(2):143-9.
4
Life Sci. 2008 Apr 9;82(15-16):884-91.
Diabetes Obes Metab誌への申立て
件名
Allegations of fabrication and falsification (Diabetes Obes Metab. 2009 11:143-9)
宛先
susan.lane@nottingham.ac.uk
CC
jdom@bcm.tmc.edu
Dear Dr. Donnelly,
Please investigate fraudulent data of the article “Glimepiride upregulates eNOS activity and inhibits cytokine-induced NF-kappaB activation through a phosphoinoside 3-kinase-Akt-dependent pathway.” by Jojima T, Suzuki K, Hirama N, Uchida K, Hattori Y., published in
Diabetes, Obesity and Metabolism (2009 Feb;11(2):143-9). You can find fabricated (falsified) Figure 2(B) : namely,
(1) The first, second and third bands from left (for 0, 5, 15 min) of p-Akt image, top-panel in Figure2(B) of the above article (Ref.3) are similar to both the second, third and forth bands from left (15,30,60 min) of IkB-alpha image, top-panel in Figure4(A) of Ref.1 and the second, third and forth bands from left (for 0, 30, 100 uM fenofibrate) of IkB-alpha image in Figure4(B) of Ref.1.
(2) The forth band (for 30 min) from left of pAkt image, top-panel in Figure2(B) of the above article (Ref.3)is similar to The leftmost band (for Cont) of IkB-alpha image in Figure4(A) of Ref.1
________Other misconducts by these author_____________
(I) The GST-Ikb-alpha image of top panel in Figure4(C) of the above article (Ref.1) is quite similar to both GST-Ikb-alpha image of top panel in Figure4(C) of another article (Ref.2) and Ikb-alpha image of top panel in Figure5(C) of another article (Ref.4)
(II) The GST-Ikb-alpha image of bottom panel in Figure4(C) of Ref.2 is quite similar to GST-Ikb-alpha image of bottom panel in Figure4(C) of Ref.4. Moreover, these two images are quite similar to both the left-right reversal of the Akt image in Figure 1(A) of Ref.1 and the upside-down + left-right reversal of the GST-Ikb-alpha image of bottom panel in Figure4(C) of Ref.1
(III) The AMPK image and pAMPK image in Figure1(A) of Ref.1 are similar to the AMPK image and pAMPK image in Figure1(A) of Ref.4, respectively.
(IV) The p-Akt image in Figure1(A) of Ref.1 is similar to the p-Akt image in Figure1(A) of Ref.4.
(V) The eNOS image in Figure1(A) of Ref.1 is similar to the left-right reversal of eNOS image in Figure1(A) of Ref.4.
(VI) The leftmost band (for 0 min) of IkB-alpha image, top-panel in Figure4(A) of Ref.1 is similar to the leftmost band of GST-IkB-alpha image, bottom-panel in Figure4(C) of Ref.1.
References
1,
Metabolism. 2010 Jun 25. [Epub ahead of print]
2,
Cardiovasc Res. 2009 Jan 1;81(1):133-9. Epub 2008 Aug 14.
3
Diabetes Obes Metab. 2009 Feb;11(2):143-9. Epub 2008 Jun 16.
4
Life Sci. 2008 Apr 9;82(15-16):884-91. Epub 2008 Feb 16.


