![](https://blogimg.goo.ne.jp/user_image/0c/17/1cae334fe20ab95df33dabf00dd8156e.jpg)
タグ: ヒストグラム
![](https://learn.zoner.jp/wp-content/uploads/2013/04/title.jpg)
気付いていないかもしれませんが、全てのカメラでヒストグラムを見つけることができます。最下位モデルでもです。 Zoner Photo Studio Xを含む写真エディターには、ヒストグラムも表示されます。しかし、ヒストグラムの使い方をあなたはよく知っていますか?
ヒストグラムは、1つ、または複数のRGB(赤/緑/青)チャネルの255の輝度レベル(0(黒)から127/128(ニュートラルグレー)から255(白)まで)を示すグラフです。各列には特定の輝度レベルが表示され、通常は赤、緑、青を組み合わせたものです。
したがって、通常、全体的な明るさのヒストグラムが表示されます。ほとんどのフォトグラファーは、このタイプを最も良く使用します。主に、255レベル全てで写真が適切に露出されているかどうかを確認し、光や影で露出オーバーまたは露出アンダーの写真をキャッチします。これらの問題により詳細が失われるため、これらのチェックを行います。
理想的なヒストグラム
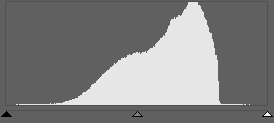
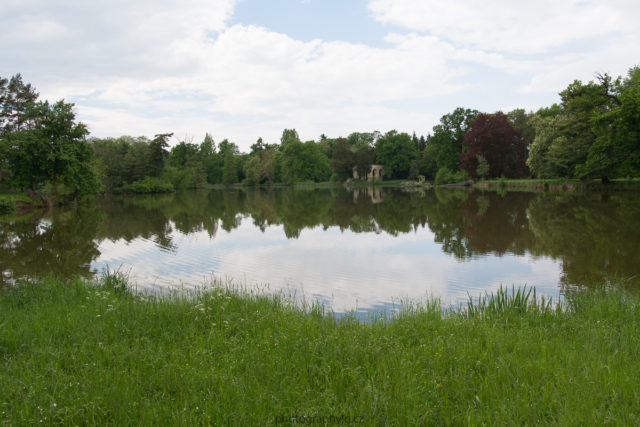
理想的なヒストグラムは丘のように見えるべきだという意見のフォトグラファーもいます。しかし、実際には多くの理想的なヒストグラムがあります。 それはすべて、現時点で何を撮影しているかによって異なります。
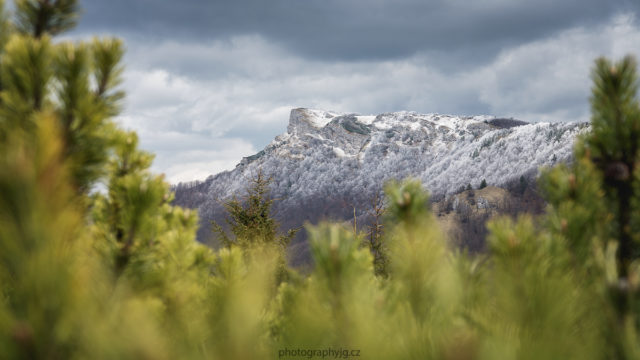
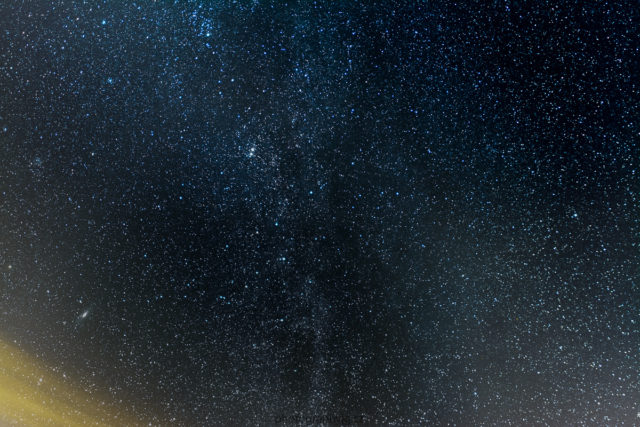
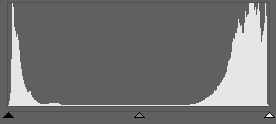
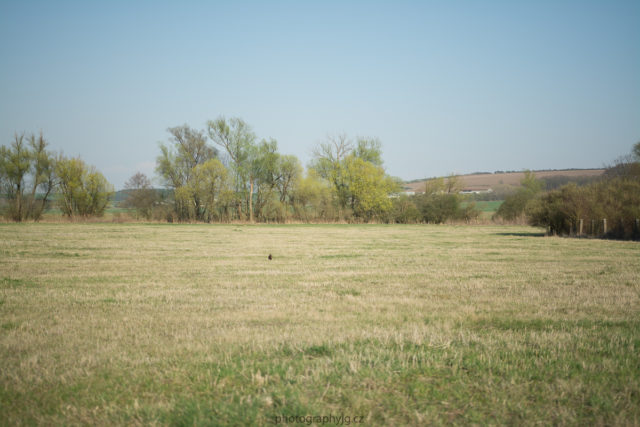
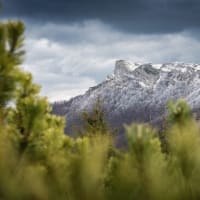
星を撮影する場合は、露出オーバーの境界にヒストグラムを作成して、星を最大限に活用してノイズを最小限に抑えることができます。ただし、風景写真にそのようなヒストグラムがある場合は、写真から空を消去する危険があります。露出オーバーになります。
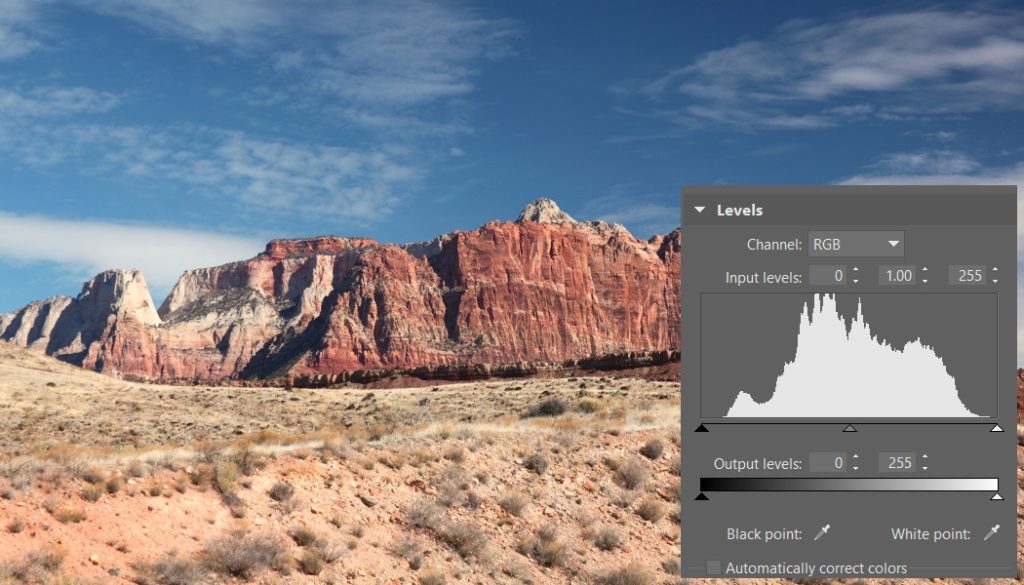
そのため、風景写真では、可能な限り多くの情報を、最も白い白から最も黒い黒まで均等に維持する必要があります。これにより、写真の露出オーバーと露出アンダーの量を最小限に抑えることができます。
![This photo is correctly exposed, with no overexposed or underexposed areas.](https://learn.zoner.com/wp-content/uploads/2013/04/mountain.jpg)
![This histogram looks like a beautiful mountain range; it’s evenly distributed from 0 to 255. This is the classical “ideal histogram.”](https://learn.zoner.com/wp-content/uploads/2013/04/ideal_histogram.jpg?fidl=2019-06-mag-en)
![A star photo whose exposure is on the line, maybe past it. At first glance the picture seems empty. After making some histogram-guided exposure edits and developing the photo, I squeezed quite a bit out of it, even though it had seemed lost before.](https://learn.zoner.com/wp-content/uploads/2013/04/no_stars.jpg)
![The histogram says only one thing: insalvagable picture. I admit this is a bit extreme even for stars, but there’s still room to work with it.](https://learn.zoner.com/wp-content/uploads/2013/04/overexposed_star_exposure.jpg?fidl=2019-06-mag-en)
![This really is the same picture that you saw above. I just had to play with Curves and Levels in ZPS.](https://learn.zoner.com/wp-content/uploads/2013/04/stars_after_edit.jpg)
![The histogram after editing using Levels and Curves and then developing the picture. It’s mainly the left side of the histogram that’s moving. You can see both stars and light pollution in the photo.](https://learn.zoner.com/wp-content/uploads/2013/04/histogram_after_star_edit.jpg?fidl=2019-06-mag-en)
カメラ内のヒストグラム
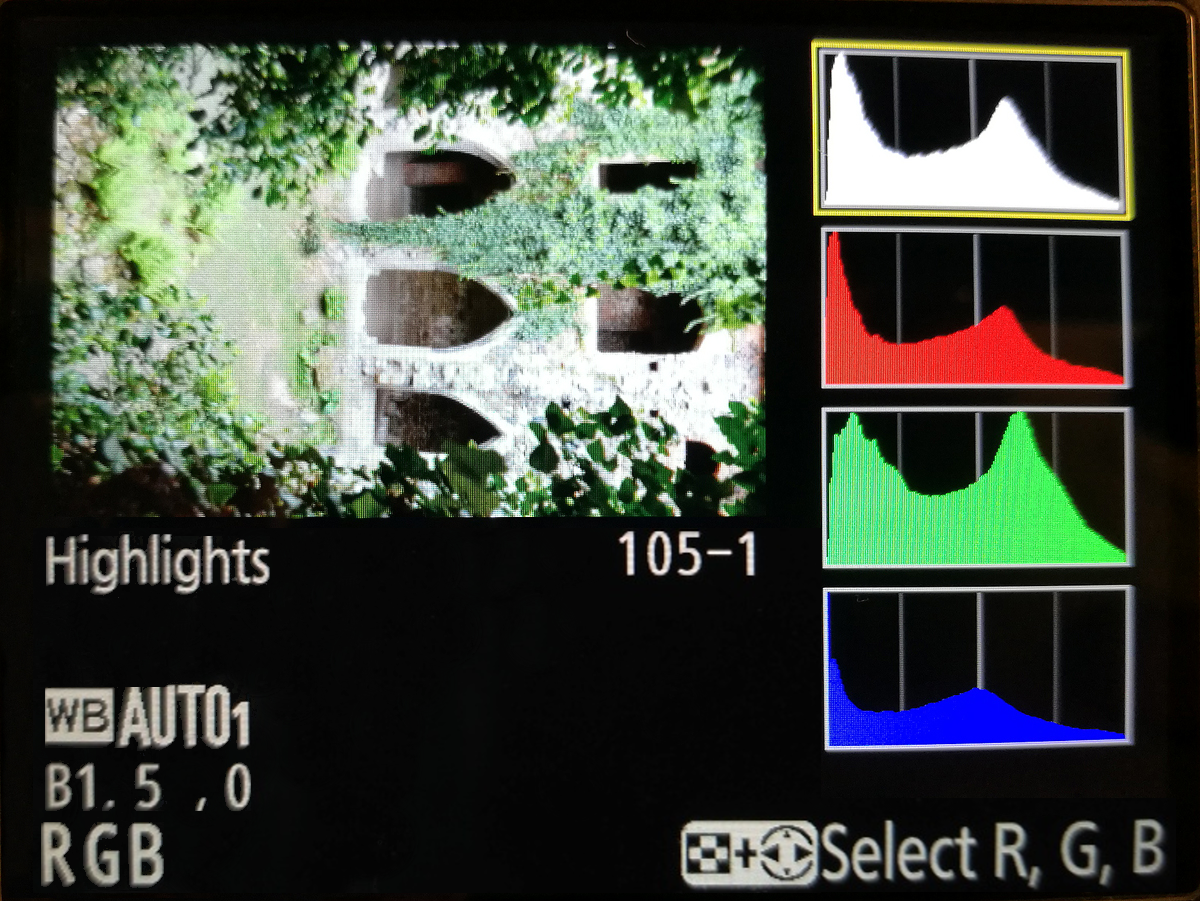
ほとんどのカメラは、全体的な明るさとRGBチャンネルの両方について、撮影後にヒストグラムを表示できます。最新のカメラ、特にミラーレスカメラのほとんどは、デジタルビューファインダーで撮影しているときにヒストグラムを表示する事もできます。これは「ライブヒストグラム」と呼ばれます。一方、プロのデジタル一眼レフカメラは、ライブプレビュー中にカメラのディスプレイにヒストグラムを表示します。
したがって、カメラ内のヒストグラムは、写真の露出オーバーと露出アンダーのチェックに役立ちます。たとえば、画面上で写真が明るすぎて画面に表示されない場合に特に役立ちます。
写真内の最も明るいスポットの表示もあります。これは、写真を確認するのに便利なツールです。 露出オーバーのスポットが表示されるためです。この情報をカメラに表示するためのガイドについては、そのマニュアルを参照してください。
たとえば、Nikon D3100およびD7100では、画像を表示し、”Info”ボタンを押してから、オプションの十字の上矢印を押すと、ヒストグラムが表示されます。カメラのメニューで、写真に表示する情報または表示したくない情報を設定することもできます。
![Showing the RGB histogram along with the brightness histogram and the highest brightnesses as well—one kind of histogram display offered on Nikon cameras. Here the green channel dominates the most, due to the large amount of green in the picture. But none of the RGB channels are overexposed.](https://learn.zoner.jp/wp-content/uploads/2017/07/EN_histogram_RGB-683x513.png)
![The quickest way to see if a picture is overexposed is to show the highest brightnesses. They blink in black right inside the picture, so that you can see where you’re losing detail in the lights.](https://learn.zoner.jp/wp-content/uploads/2017/07/gif_exposure.gif)
写真の補助としてのヒストグラム
写真の撮影中にヒストグラムを正しく使用することをお勧めしますが、注意してください。 ヒストグラムを独断的に判断しないでください。まったく使用せずに素晴らしい写真を持っている写真家もいます。
いずれにせよ、それは大変使いやすいです。写真の撮影が終了するとすぐに、ヒストグラムを確認します。それに基づいて、露出をプラスまたはマイナスの値に移動します。これにより、露出オーバーと露出アンダーの写真を撮ることを避け、その後の写真編集作業を簡単にします。
![Crossing the line in the shadows – some detail has been lost in the darkest parts of this photo, and so the histogram shows it as underexposed. But in reality it’s an interesting artistic image. It makes you want to focus on just the pelican and the water drops flying off of its feathers. So even though it really is underexposed, there’s nothing wrong with it from a creative standpoint.](https://learn.zoner.com/wp-content/uploads/2013/04/histogram_pelican_crossing_line_shadows.jpg?fidl=2019-06-mag-en)
![Crossing the line in the shadows and lights – here the photographed scene truly did have a high dynamic range (i.e. a high contrast). Because of this, information was lost in both the shadows and the lights. This photo is thus, paradoxically, both overexposed and underexposed.](https://learn.zoner.com/wp-content/uploads/2013/04/histogram_crossing_line_lights.jpg?fidl=2019-06-mag-en)
![The opposite of the previous histogram – the scene being photographed lacked dynamic range, and so the photo lacks contrast in the shadows and lights. So it’s appropriate to adjust the histogram using Levels and Curves so that it reaches all the way from 0 to 255, i.e. from left to right. That gives contrast in the lights and the shadows.](https://learn.zoner.com/wp-content/uploads/2013/04/histogram_poor_contrast.jpg?fidl=2019-06-mag-en)
![In this histogram you can see that there’s been no loss of detail in either the lights or shadows. So the picture you see before you has technically correct exposure.](https://learn.zoner.com/wp-content/uploads/2013/04/histogram_correct_exposure.jpg?fidl=2019-06-mag-en)
写真編集時にヒストグラムを使用する方法
また、パソコンで Zoner Photo Studio Xを使用して写真真を編集するときにヒストグラムを有効に活用できます。ヒストグラムを調整して画像の輝度レベルを操作するために使用します。つまり、画像の明るさとコントラストを調整するために使用されます。
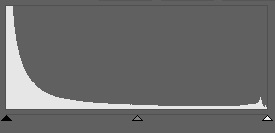
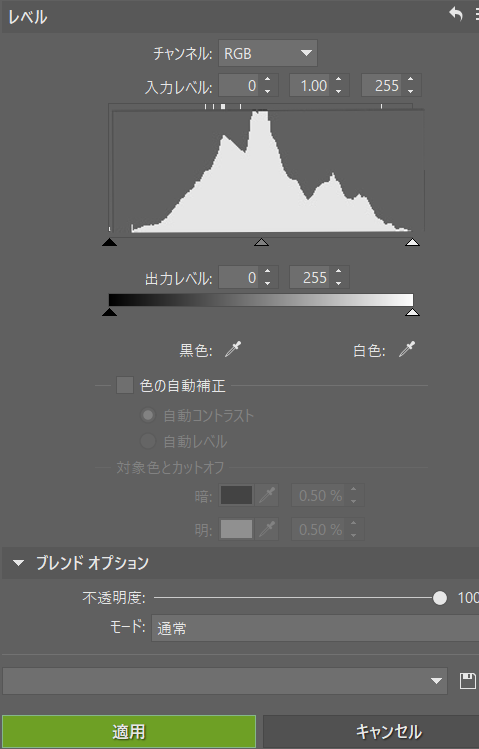
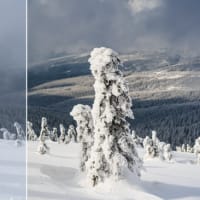
レベル(Shift + L)を使用して、利用可能な範囲全体にヒストグラムを引き伸ばすことにより、ヒストグラムを修正できます。入力レベルは、0〜255です。このアプローチを利用できます。写真にコントラストがなく、これら2つのレベルのいずれにも到達しない場合。 つまり、絶対白または絶対黒です。
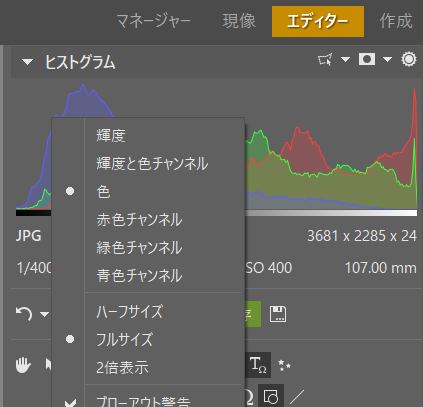
Zoner Photo Studio は、曲線(Shift + C) 曲線(Shift + C)機能を使用している場合にもヒストグラムを表示します。 露出オーバーのスポットの強調表示(「ブローアウト」と呼ばれる)に加えて、他のツールでこのヒストグラムを呼び出すこともできます。右側のパネルの対応するボタン(ヒストグラムと太陽)をクリックするだけです。
ヒストグラムで常識を使用する
最後に重要なことを強調しなければなりません。ヒストグラムでは、写真が良いか悪いかはわかりません。技術的に正しい露出であるかどうかのみを示します 。
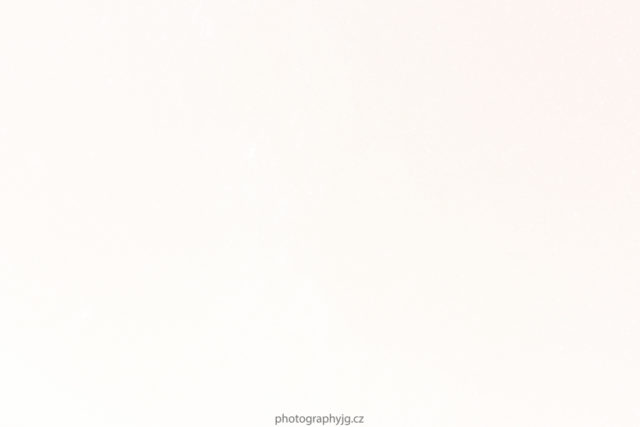
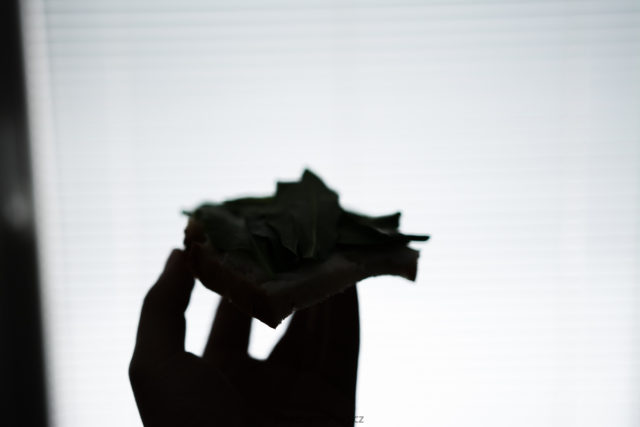
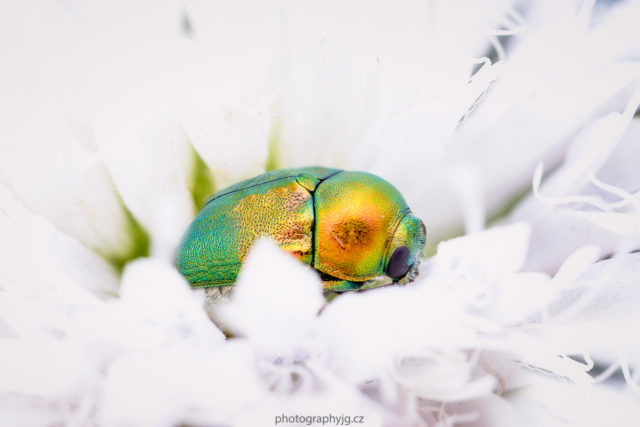
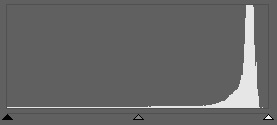
製品の写真を白い背景で撮影すると、ヒストグラムはほとんど右側になりますが、写真は良好です。マクロ撮影でも同様の状況が発生する可能性があります。 このバグの写真は、ヒストグラムでは破裂した時点に近いとはいえ、芸術的には素晴らしいものです。
そのため、ヒストグラムの解釈には注意が必要です。また、主に露出オーバーと露出アンダーのクイックチェックとして存在することを忘れないでください。
![The histogram shows a picture that’s almost overexposed, but the reality is a bit different. The way this photo is perceived is heavily influenced by the fact that most of it is white.](https://learn.zoner.com/wp-content/uploads/2013/04/histogram_bug.jpg?fidl=2019-06-mag-en)
※コメント投稿者のブログIDはブログ作成者のみに通知されます