set multiplot;

plot 'data.dat' \
   using 1:2 with points title "data1", \
'' using 1:3 with points title "data2", \
'' using 1:4 with points title "data3";

unset key;
unset label;

# 小窓の指定。左下を(X,Y)とした小窓を作成。
# 元の大きさ(1.0, 1.0)に対して横にX倍、縦にY倍。
# set origin X, Y;
# set size X, Y;
set origin 0, 0;
set size 0.5, 0.5;

# 様々な設定 -> 不要なら '' と指定
# xrange / yrange / logscale
# title / xtics / ytics / xlabel / label

plot 'data.dat' \
   using 1:2 with points title "data1", \
'' using 1:3 with points title "data2", \
'' using 1:4 with points title "data3";

set nomultiplot;
最新の画像[もっと見る]
-
 自己紹介(last update: 2014.04.15)
10年前
-
 自己紹介(last update: 2014.04.15)
10年前
-
 Graph500, Green Graph 500 (June 2013)
11年前
-
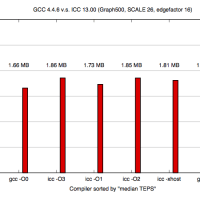 Intel コンパイラ -xHost オプション
12年前
-
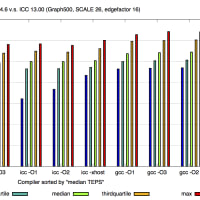 Intel コンパイラ -xHost オプション
12年前
-
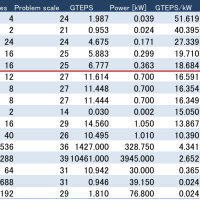 Graph500 / GreenGraph500 Nov. 2012
12年前
-
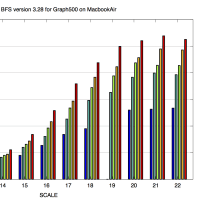 1 node Graph500 その5
12年前
-
 1 node Graph500 その5
12年前
-
 1 node Graph500 その5
12年前
-
 1 node Graph500 その4
12年前


※コメント投稿者のブログIDはブログ作成者のみに通知されます