Arduinoに追加されたシリアルプロッタは手軽に使えて動作の確認も簡単です。
自動的に、縦軸のレンジが自動で変化するのはお手軽に使えて良いのですが、サンプリングレートが高くなると表示が変化しすぎて目が回るような感じになります。
縦軸、横軸のレンジを決めて動作するプログラムがほしくなりました。手軽に使えるProcessing言語を利用して作ってみました。ひな型になるプログラムが「Arduino シリアル通信 その1:processing」にあったのでそのプログラムを手直ししたものです。
シリアル受信データ
2つの数字をカンマ区切りで一定間隔に出力したものです。シリアルポートから受信します。
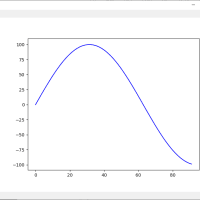
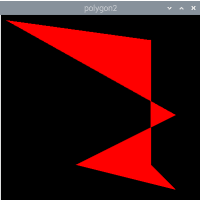
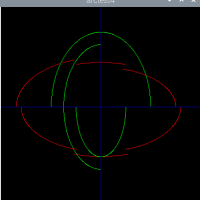
動作画面

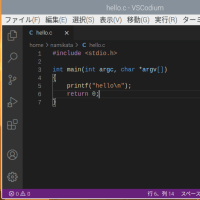
プログラムリスト
自動的に、縦軸のレンジが自動で変化するのはお手軽に使えて良いのですが、サンプリングレートが高くなると表示が変化しすぎて目が回るような感じになります。
縦軸、横軸のレンジを決めて動作するプログラムがほしくなりました。手軽に使えるProcessing言語を利用して作ってみました。ひな型になるプログラムが「Arduino シリアル通信 その1:processing」にあったのでそのプログラムを手直ししたものです。
シリアル受信データ
2つの数字をカンマ区切りで一定間隔に出力したものです。シリアルポートから受信します。
-0.369629,0.001532
-0.450195,0.002479
-0.546875,0.003281
-0.650879,0.004101
-0.796875,0.004864
動作画面
プログラムリスト
- // 参考サイト http://shirotsuku.sakura.ne.jp/blog/?p=192
- import processing.serial.*;
- int displaytime = 4; //表示時間
- float gscale = 1; // 縦軸の倍率
- int samplingrate = 1000; //サンプリングレート
- int displayxsize = 1200; //ディスプレイの横幅
- int displayysize = 800; //ディスプレイの高さ
- String comport = "COM5"; //シリアルポート
- int comspeed = 115200; //通信速度
- int DATASIZE = samplingrate * displaytime;
- //int lf = 0x0d; // ASCII linefeed
- //シリアルポートを使用する
- Serial myPort;
- float val;
- float [] x = new float[DATASIZE]; //グラフ用データ x:時間
- float [] y1 = new float[DATASIZE]; //グラフ用データ y:電圧
- float [] y2 = new float[DATASIZE]; //グラフ用データ y:電圧
- void setup()
- {
- frameRate(50); //20msec毎にグラフを更新
- size(displayxsize, displayysize);
- myPort = new Serial(this, comport, comspeed);
- //myPort.bufferUntil(lf);
- textSize(20);
- //グラフ用データの初期化
- for (int i = 0; i < x.length; i++) {
- x[i] = (float)i * (float)(displayxsize-100)/(float)DATASIZE;
- y1[i] = 0;
- y2[i] = 0;
- }
- }
- void draw()
- {
- background(0);
- //グラフエリアの描画
- fill(255);
- // text("-1.6V",10,310);
- // text("+1.6V",10,54);
- text("0sec", displayxsize - 70, displayysize-10);
- float t = DATASIZE/1000;
- text("-" + t + "sec", 30, displayysize-10);
- fill(0, 255, 0);
- //text(val/255.0*5,560,100);
- //グラフのプロット
- pushMatrix();
- translate(50, displayysize-50);
- scale(1, -1);
- fill(0);
- stroke(255);
- rect(0, 0, displayxsize-100, displayysize-94);
- stroke(0, 255, 0);
- strokeWeight(1);
- for (int i = 0; i < x.length - 1; i++) {
- line(x[i], y1[i], x[i+1], y1[i+1]);
- }
- stroke(255, 0, 0);
- for (int i = 0; i < x.length - 1; i++) {
- line(x[i], y2[i], x[i+1], y2[i+1]);
- }
- popMatrix();
- }
- int bufsize = 512;
- char[] buf = new char[bufsize];
- int i = 0;
- void serialEvent(Serial myPort) {
- char c = char(myPort.read());
- //if(c=='\r') return;
- if ((i<bufsize)&&(c!='\n'))
- {
- buf[i] = c;
- i++;
- } else
- {
- buf[i]=0;
- i=0;
- String s = new String(buf);
- float data[] = float(s.split(",", 0));
- //グラフ用データの更新
- for (int i = 0; i < y1.length - 1; i++) {
- y1[i] = y1[i+1];
- y2[i] = y2[i+1];
- }
- // 0〜(displayysize-94)の間で変化するように
- y1[y1.length - 1] = (data[0]+0)*(displayysize-94)*gscale/2 + (displayysize-94)/2;
- // 0〜(displayysize-94)の間で変化するように
- y2[y2.length - 1] = (data[1]+0)*(displayysize-94)*gscale/2 + (displayysize-94)/2;
- //print(data[0]);
- //print(" ");
- //println(s);
- }
- }